Chemistry Reference
In-Depth Information
a
b
c
2
2
1
1
1
0
0
1
-
0
-
-
-
-
-
-
0
1
2
3
4
Energy (eV)
-
0
4
4
5
5
6
4
4
5
5
6
Site
Site
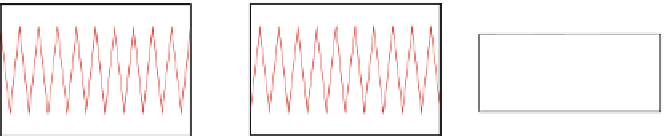
Fig. 8.5 HF solution for CDW. (a) Halogen lattice displacements, (b) electron density, and
(c) a one-electron energy band diagram. In (c), the band center that is originally at
U=
2
þ
2
V
is
set to the origin
1
N
l
bðkÞÞ; k ¼p=
e
ikl
p
ðaðkÞþð
1
Þ
2
; p=
2
þ
2
p=N; ...; p=
2
2
p=N
;
(8.11)
where
N
is assumed to be a multiple of 4, and the coefficients are defined as
s
E
k
2
T
cos
ðkÞ
aðkÞ¼
;
(8.12)
2
E
k
and
s
E
k
2
T
cos
ðkÞ
bðkÞ¼
:
(8.13)
2
E
k
Now, we are prepared to determine the magnitudes of the mean fields, i.e.,
dn
and
m
, for each set of the model parameters. Below, we show one example
of the results obtained for a realistic parameter set for the PtCl complex, that is,
(
U
,
V
,
S
,
t
0
)
(2.0, 1.2, 0.27, 1.3) in units of eV. Readers may remember a simple
arithmetic, 4
S þ
¼
2
V>U
, for a stable CDW, which assures a truly stable CDW
solution for this parameter set. In Fig.
8.5
, we draw the lattice distribution and the
electron density thus obtained also with the one-electron energy band diagram. As
is seen in (b), the densities at the two nonequivalent sites are 1.64 and 0.36, which
correspond to M
+2.36
and M
+3.64
, respectively. Such fractional valencies are a
feature of the itinerant system. When we pay attention to the energy bands, we
notice the energy gap between the conduction and valence bands. The value of
3.15 eV is larger than the optical gap of the PtCl compound, i.e., about 2.7 eV [
16
,
17
], and the readers may think that the present parameter set will not be appropriate
for explaining this compound. In the next subsection, we explain how this discrep-
ancy will be solved by a further analysis.


Search WWH ::

Custom Search