Biomedical Engineering Reference
In-Depth Information
1100
1000
900
800
700
600
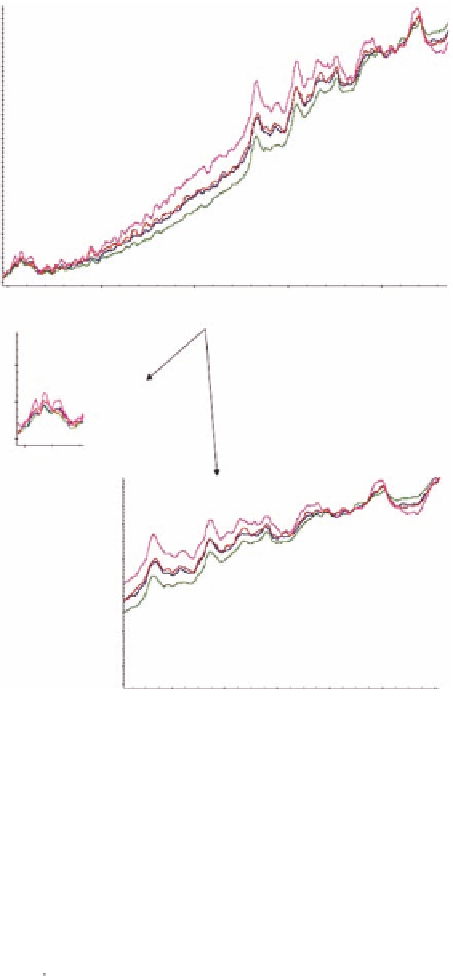
Pink
: A2780S-Control
Red
: A2789SCis-0.3umCDDP
Blue
: A2789SCis-1umCDDP
Green
: A2789SCis-3umCDDP
500
400
300
200
100
0
3000
2500
2000
1500
1000
Raman Shift (cm
-1
)
200
100
CH region
0
3000
1100
1000
900
800
700
600
500
Fingerprint
region
400
300
200
100
0
1600
1400
1200
Raman Shift (cm
-1
)
1000
800
Figure 6.7
Spectra of S samples treated with different concentrations of cisplatin.
1: CH region
2: Amide I
3: C=C (Protein Assignment)
4: CH
2
/CH
3
(Proteins + Phospholips)
5: CH
3
CH
2
wagging (Nucleic acids + Proteins)
6: Amide III
7: Aromatic CO and CN
8: vs PO
2
- (Nucleic acids + Phospholipids)
9: C-O stretching (Carbohydrates)
1700
1600
1500
1400
1300
1200
1100
1000
900
800
700
600
500
400
300
200
100
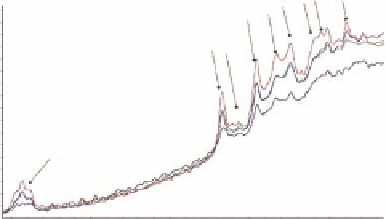
11
8
9
13
12
10
7
6
5
4
10: vs (C-C) (Proteins)
11: p(CH
2
/CH
3
) + v(C-C) (Proteins)
12: v(C-C), δ(CCH) (Proteins + Polysaccharides)
13: O-P-O of DNA
2
3
: Gradual decrease in peak intensities
Red
: A2780R-Control
Blue
: A2789RCis-10umCDDP
Green
: A2789RCis-20umCDDP
Purple
: A2789RCis-30umCDDP
1
3000
2500
2000
Raman Shift (cm
-1
)
1500
1000
Figure 6.8
Changes in spectra of treated R samples.
Search WWH ::

Custom Search