Biomedical Engineering Reference
In-Depth Information
30
20
10
0
0
10
20
30
x
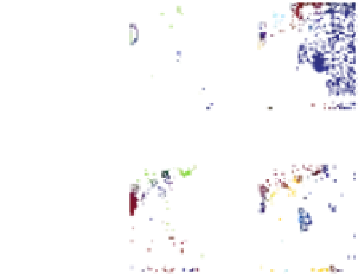
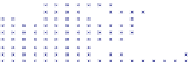
Figure 5.43
GI: regions containing the clusters, and the clusters are plotted with their (
x
,
y
) coordinates.
K-means (2)
K-means (3)
K-means (4)
Ward's (2)
Ward's (3)
Ward's (4)
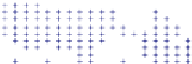
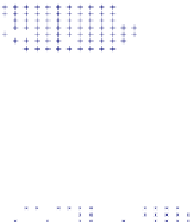
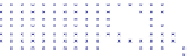
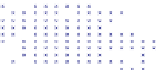
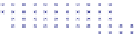
Figure 5.49
K-means and hierarchical clustering (Ward's method) into 2, 3, and 4 clusters.


Search WWH ::

Custom Search