Biomedical Engineering Reference
In-Depth Information
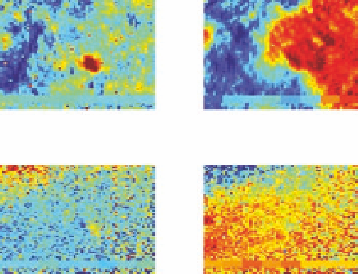
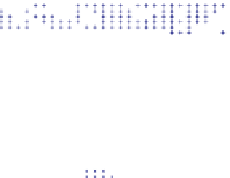
PC1 scores
PC2 scores
PC3 scores
PC4 scores
Figure 5.25
The second principal component (PC2) provides the same contrast as the difference between the
bands at 1057 and 1215 cm
−1
. The first PC identifies a small region near the centre of the image.
30
20
10
0
0
10
20
30
x
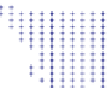
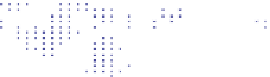
Figure 5.31
Rectangular regions around the samples; spatial (
x
,
y
) coordinates calculated and plotted.
30
0.15
3
1
20
0.1
2
10
0.05
0
0
10
20
30
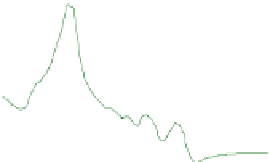
1000
1500
2000
x
Wavenumber
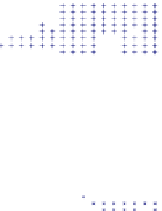
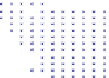
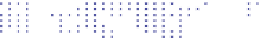
Figure 5.41
GII: spatial coordinates of points in three clusters.


Search WWH ::

Custom Search