Biomedical Engineering Reference
In-Depth Information
0.5
A
0.4
0.3
0.2
0.1
0.0
1800
1600
1400
Wavenumber, cm
-1
1200
1000
800
0.5
B
1640
1630
1542
1522
0.4
0.3
0.2
0.1
0.0
1700
1600
Wavenumber, cm
-1
1500
1400
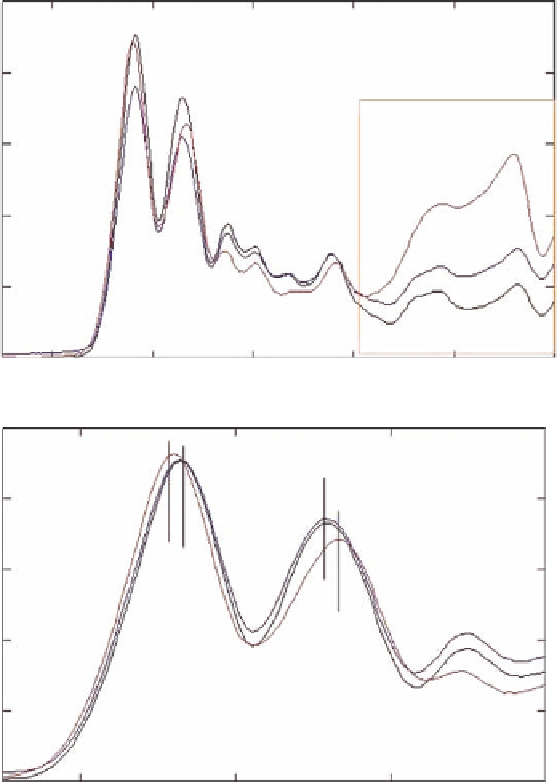
Figure 5.13
A: FTIR differences among IDC grades (I, in black; II in blue; and III, in red). B: Peak shifting in
protein amide I and II regions.
Search WWH ::

Custom Search