Biomedical Engineering Reference
In-Depth Information
2.0
1.9
(A)
1.8
1.7
1.6
1.5
1.4
1.3
1.2
1.1
1.0
0.9
0.8
0.7
0.6
0.5
0.4
0.3
0.2
0.1
4000
3500
3000
2500
2000
1500
1000
500
Wavenumbers (cm-1)
Polyurethane
12000
(B)
11000
10000
9000
8000
7000
6000
5000
4000
3000
2000
1000
-0
3500
3000
2500
2000
1500
1000
Raman shift (cm-1)
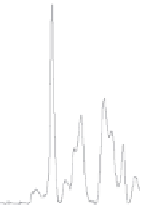
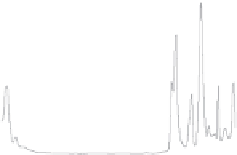
Figure 1.8
FTIR (A) and Raman (B) spectra of polyurethane.
easy to resolve, and sensitive to molecular structure, conformation, and
environment.
Raman spectroscopy and FTIR are relevant techniques, with their respec-
tive spectra complementary to one another. In spite of this fact, there are
some differences between these two techniques. Figure 1.8 shows spectra
for Raman and FTIR, and the main differences between the two meth-
ods can be seen in Table 1.2. Probably the most important difference is the
type of samples that can be investigated by each of these methods. FTIR
mainly deals with nonaqueous samples, while Raman is as effective with
aqueous samples as it is with nonaqueous ones. This is because of the
problem with FTIR spectroscopy, which is due to strong absorption bands
of water. In Raman, however, fluorescence and the strong effect of glass
(mostly containers) are the most important problems being faced. In addi-
tion, while Raman can collect spectra in the range of 4000-50 cm
−1
, FTIR
focuses on a comparatively narrower frequency range, located in the area of
4000-700 cm
−1
(Figure 1.8).
In comparison to FTIR, Raman needs little or no sample preparation and
can do confocal imaging. FTIR, on the other hand, requires sample prepara-
tion and does not do confocal imaging. Furthermore, the physical effect of
infrared is created by absorption, and mainly influences the dipole and ionic
bands such as O-H, N-H, and C=O. Raman effect originates from scattering
(emission of scattered light) and changing of the polarisability of covalent
bands like C=C, C-S, S-S, and aromatics. In other words, FTIR spectroscopy


Search WWH ::

Custom Search