Biomedical Engineering Reference
In-Depth Information
Phosphate
Theoretically, there are four vibrational modes present for phosphate ions, ν
1
,
ν
2
, ν
3
, and ν
4
. All these modes are Raman and infrared active and are observed
for all the spectra of carbonated apatite and hydroxyapatite powders.
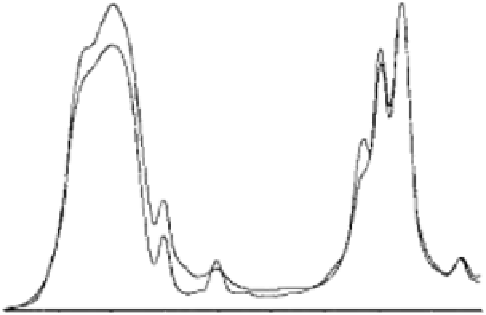
In the carbonated spectrum, a single intense ν
3
band is present at 1046 cm
−1
,
whereas, in the hydroxyapatite spectra, the ν
3
band has three different sites
present at 1096, 1085, and 1056 cm
−1
(Figure 7.16 and Table 7.1). The intense
ν
3
band is thought to be responsible for totally obscuring the ν
1
carbonate
bands [20,24,29,30].
The peak area of the ν
3
band was calculated and used to determine the
phosphate-to-carbonate ions ratio. The peak areas of the ν
3
band of carbon-
ated and hydroxyl apatite powders are given in Table 7.2. This ratio increases
with an increase in the phosphate content.
Phosphate ν
1
band is present at 961 cm
−1
and can be observed in all the
spectra of hydroxyapatite and carbonated apatites (Figures 7.7-7.12 and
Tables 7.1 and 7.2).
The phosphate ν
4
band is present in the region of 660 and 520 cm
−1
and is a
well-defined and sharp band, observed in the carbonated and hydroxylapatites.
It has two sites in the case of carbonated apatite, centred at 603 and 567 cm
−1
,
and hydroxyapatite spectra have three sites observed at 633, 602, and 566 cm
−1
(see Figure 7.16 and Table 7.1). This splitting of the ν
4
vibrational band indicates
the low site symmetry of molecules, as two and three observed bands confirm
the presence of more than one distinction site for the phosphate group [31].
The phosphate ν
1
band is observed in the region of 475 and 440 cm
−1
and
has two sites. These are weak bands, not as strong as the ν
3
and ν
4
bands.
(b)
(a)
1223
1135
1047
959
871
783 95
607 19
431
Wavenumber (cm
-1
)
Figure 7.16
FTIR spectra of carbonated (a) and hydroxyl (b) apatites, phosphate (v
3
) and (v
4
) bands. (With
permission.)

Search WWH ::

Custom Search