Biomedical Engineering Reference
In-Depth Information
• The spectra of the treated S samples do not show the desirable
reproducibility. This can be attributed to the sensitive nature of
the cells, and the fact that they undergo severe and unpredictable
changes when treated with chemotherapeutic medications. Similar
findings can be observed only for the R samples treated with the
strongest agent used in this study (30 μm). Once again, this can be
attributed to the resistant nature of the cells.
Other Testicular Cell Lines
Similar experiments conducted for 833k samples were employed on two
other types of testicular cancer cell lines, namely, GCT27 and Susa; and simi-
lar results were obtained. Spectra for GCT27 and Susa samples are given in
Figures 6.14 and 6.15.
lymphoma Cell lines
At this part, a total of three DHL4 samples were analysed and compared to
testicular samples. Figures 6.16 and 6.17 illustrate the comparative images
of DHL4, and Susa R and S, respectively, with the responsible cellular com-
pounds for each peak. Table 6.6 presents the peak definitions of the spectra.
As predicted, the difference between DHL-4 and Susa samples is more
outstanding than that of cell lines belonging to the same tissues. However,
lymphoma cells are more different from the S type Susa cell line than the
R type. This could be an interesting topic for further analysis. It seems that
proteins and carbohydrates in the spectra range of 1000-1200 cm
−1
illustrate
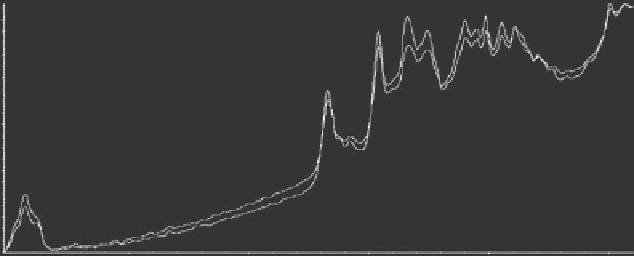
4400
4000
Red
: GCT27 (R)
Blue
: GCT27 (S)
4200
3800
3600
3400
3200
3000
2800
2600
2400
2200
2000
1800
1600
1400
1200
1000
800
600
400
200
3000
2500
2000 1500
Raman Shift (cm
-1
)
1000
500
Figure 6.14
(See colour insert.)
Comparative image of GCT27 spectra.

Search WWH ::

Custom Search