Biomedical Engineering Reference
In-Depth Information
1100
1000
900
800
700
600
500
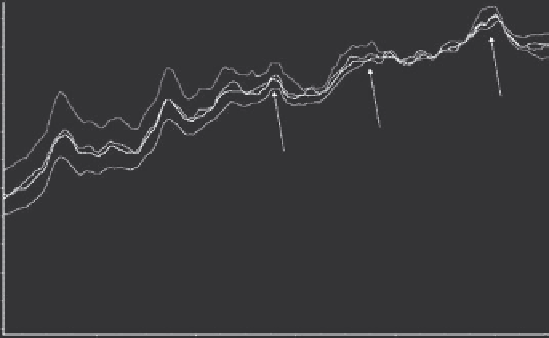
Sudden decrease of the peak intensities of
the S sample in the �ngerprint region
400
300
200
100
0
Pink
: A2780S-Control
Red
: A2789SCis-0.3umCDDP
Blue
: A2789SCis-1umCDDP
Green
: A2789SCis-3umCDDP
1600
1400
1200
1000
800
Raman Shift (cm
-1
)
Figure 6.12
(See colour insert.)
Treated S spectra, fingerprint region.
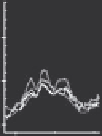
Pink
: A2780S-Control
Red
: A2789SCis-0.3umCDDP
Blue
: A2789SCis-1umCDDP
Green
: A2789SCis-3umCDDP
200
100
0
3000
Sudden change in the
peak intensities of the S
samples in the CH region
Figure 6.13
(See colour insert.)
Treated S spectra, CH region.
• Resistant cell lines illustrate a totally different process: Those treated
with 10 and 20 μm of the medication show moderately severe changes
in comparison with the control samples. However, more pronounced
changes can be observed for cells treated with 30 μm of the drugs. In
other words, a relatively step-by-step method of modification is seen
for these cell lines.
• These indings can be attributed to the sensitive and resistant
nature of the cells. In other words, sensitive cell lines illustrate
stronger reactions to the medications, and undergo sudden and
relatively sharp changes, when treated with lower strengths of the
medication. On the other hand, resistant cells are stronger, and can
withstand the effect of the drug comparably more than sensitive
cell lines.
Search WWH ::

Custom Search