Biomedical Engineering Reference
In-Depth Information
1700
1600
1500
1400
1300
1200
1100
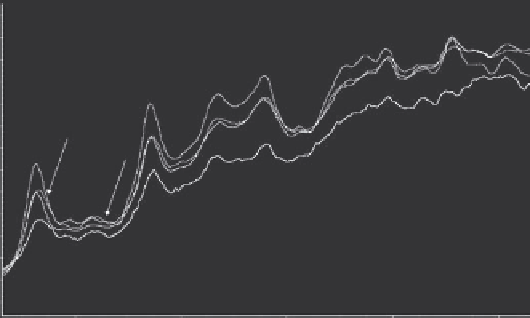
Formation of
new shoulder
1000
900
800
700
600
500
400
Red
: A2780R-Control
Blue
: A2789RCis-10umCDDP
Green
: A2789RCis-20umCDDP
Purple
: A2789RCis-30umCDDP
1600
1400
1200
Raman Shift (cm
-1
)
1000
800
Figure 6.10
(See colour insert.)
Treated R spectra, fingerprint region.
500
400
300
200
100
Red
: A2780R-Control
Blue
: A2789RCis-10umCDDP
Green
: A2789RCis-20umCDDP
Purple
: A2789RCis-30umCDDP
3000
Gradual decrease of the
peak intensities of the R
samples in the CH region
Figure 6.11
(See colour insert.)
Treated R spectra, CH region.
similar to other spectral areas, applying stronger medications does not result
in further change in the peak intensities.
The results clearly indicate that Raman spectroscopy can be objectively
applied on the treated cell lines. The technique can open new horizons in
oncologic and cytologic information.
A summary of the findings are given here:
• The sensitive cell lines undergo signiicant changes under the inlu-
ence of chemotherapeutic drugs. This effect is observed in the cell
lines treated with the lowest concentrations of the medication, and
subsequent increases in the strength of the medication do not lead
to dramatic changes.

Search WWH ::

Custom Search