Biomedical Engineering Reference
In-Depth Information
Table 6.2
Peak Definitions of 833K Samples
Peak Position
in S (cm
−1
)
Peak Position
in R (cm
−1
)
Definition
Assignment
483
n/a
Phosphate
Nucleic acids + phospholipids
862 (shoulder)
n/a
ν(C - C), δ(CCH)
Proteins + polysaccharides
880
884
ρ(CH
2
) + ν(C - C)
Proteins (proline, valine,
hydroxypro, tryptophan)
936
941
ρ(CH
3
) terminal +
ν(C - C)
Proteins (α-helix, proline,
valine, keratin)
1004
1005
ν(CO), ν(CC), δ(OCH)
Proteins (phenylalanine) +
polysaccharides
1049
1053
C - O stretching +
bending
Carbohydrates
1089
1097
ν
s
PO
2
−
Nucleic acids + phospholipids
1249
1246
ν(CN), δ(NH)
Proteins (amide III, α-helix,
collagen, tryptophan)
1333
1319
CH
3
CH
2
wagging
Nucleic acids + proteins
1453
1454
δ(CH
2
) δ(CH
3
)
Proteins + phospholipids
1663
1671
ν(C = O)
Proteins (amide I, α-helix,
collagen, elastin)
2928
2930
CH region
Nucleic acids + proteins +
lipids
1.2
1
0.8
0.6
0.4
0.2
0
Resistant
Sensitive
3000
2750
1750 1500
Wavenumber/cm
-1
1250
1000
750
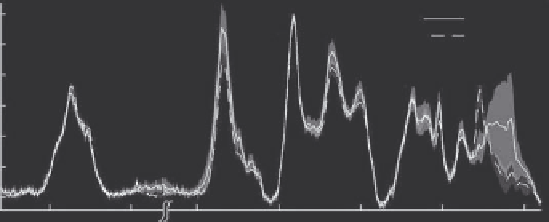
Figure 6.2
Raman spectra of resistant and sensitive testicular cell lines.
Kateinen et al. [18] chose one fifth of the spectra of their study for
quantitative and statistical analysis of their results. However, the authors
carried out the process of quantification on two thirds of the spectra. This
included a total of 40 randomly chosen spectra, consisting of 20 R and 20 S
spectra. The peak heights and peak areas of the selected spectra were calcu-
lated using Omnic Software version 7.3a.


Search WWH ::

Custom Search