Biomedical Engineering Reference
In-Depth Information
K-means (2)
K-means (3)
K-means (4)
Ward's (2)
Ward's (3)
Ward's (4)
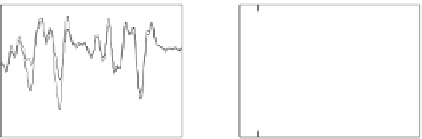
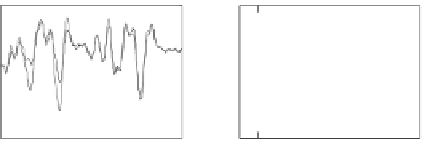
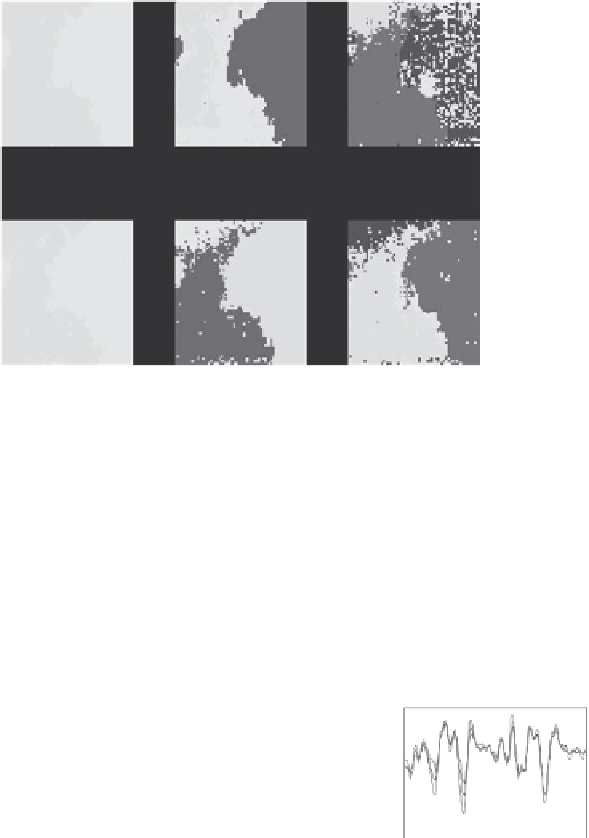
Figure 5.49 (See colour insert.)
K-means and hierarchical clustering (Ward's method) into 2, 3, and 4 clusters.
× 10
-4
K-means (2)
× 10
-4
K-means(3)
K-means(4)
× 10
-4
5
5
5
0
0
0
-5
-5
-5
-10
-10
-10
1000
1500
1000
1500
1000
1500
× 10
-4
Ward's (2)
× 10
-4
Ward's (3)
× 10
-4
Ward's (4)
5
5
5
0
0
0
-5
-5
-5
-10
-10
-10
1000
1500
1000
1500
1000
1500
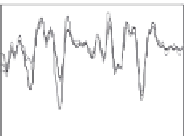
Figure 5.50
Mean spectra for each cluster.
Fabian et al. [71,72] present some studies comparing
mapping
(point-by-
point) with
imaging
(FPA camera) for both benign and malignant breast
tumours. The samples were 7-µm slices on BaF
2
windows, and the spectra
were measured in transmission. They describe FTIR microspectroscopy as
an imaging method that uses “infrared absorbance as an intrinsic contrast
mechanism.” [71] They used hierarchical clustering (with Ward's method for


Search WWH ::

Custom Search