Biomedical Engineering Reference
In-Depth Information
30
20
10
0
0
10
20
30
x
Figure 5.43 (See colour insert.)
GI: regions containing the clusters, and the clusters are plotted with their (
x
,
y
) coordinates.
0.2
Cluster 2
0.15
Cluster 2
0.15
0.1
0.1
0.05
0.05
Cluster 1
Cluster 1
50
100
150
200
250
1000
1200
1400
1600
1800
2000
Wavenumber
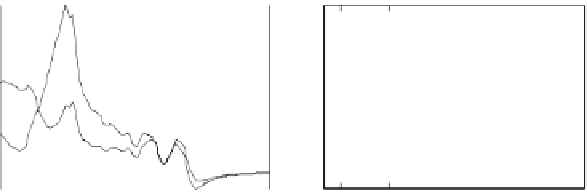
Figure 5.44
GI: a plot of some of the original spectra (wavenumber cm
−1
).
× 10
-5
30
5
0
20
-5
10
-10
0
-8
-6
-4
-2
0
10
20
30
x
T1
× 10
-4
Figure 5.45
HNG, clustering histogram for T1 and T2, and the clusters plotted with their (
x, y
) coordinates.


Search WWH ::

Custom Search