Biomedical Engineering Reference
In-Depth Information
0.14
1
0.12
0.1
2
0.08
0.06
0.04
3
0.02
1000
1500
2000
Wavenumber
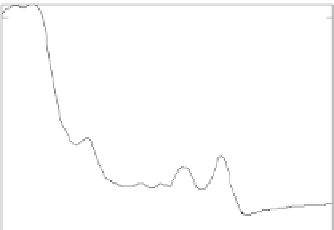
Figure 5.37
A plot of some of the original spectra (wavenumber cm
−1
).
0.2
0.15
0.1
0.05
1000
1500
2000
Wavenumber
Figure 5.38
Differences at spectral bands between ~1000 cm
−1
and ~1200 cm
−1
in all the different grades of
spectra.
this is to average over all the spectra in each cluster. Plotting all the spectra,
colour-coded by cluster, is presented in Figure 5.38, indicating that the spec-
tra are well represented by the means.
There are occasions where second-derivative spectra can provide a wealth
of information. The large bands at ~1000 cm
−1
and ~1200 cm
−1
are the main
difference among the three spectra. The spectra for clusters 1 and 3 are quite
similar, but differ in intensity. This is clearer in the second-derivative spectra
as shown in Figure 5.39.
iDC grade ii
Grade II does not display any obvious clustering in T1 versus T2. However,
there is slightly more evidence for it in T2 versus T3; both of the clusters are
given in Figure 5.40. The spatial coordinates of points in these three clusters
are plotted in Figure 5.41. Where blue asterisks are the largest (bottom) cluster,


Search WWH ::

Custom Search