Biomedical Engineering Reference
In-Depth Information
RMS Noise (1800-1900 cm
-1
)
× 10
-3
64
5
4
48
3
32
2
16
1
16
32
48
64
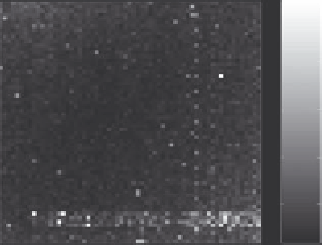
Figure 5.22
Noise levels along with a vertical line toward the right side and other isolated noisy pixels.
× 10
-4
4
2
0
-2
-4
-6
-8
1000
1200
1400
1600
1800
Wavenumber/cm
-1
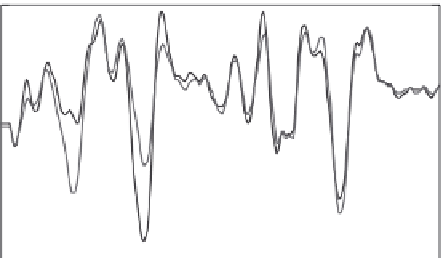
Figure 5.23 (See colour insert.)
The blue spectrum is from the left side and the green spectrum is from the right. The difference
in the relative intensities at 1057 and 1215 cm
−1
is obvious.
Principal Components Analysis (PCA)
False-colour images can also be generated by plotting the principal compo-
nent scores. From Figure 5.25, it can be seen that pixels in this region have
quite low intensity for most bands.
An alternative method is to plot the scores on one PC against the scores on
another and to look for groups that form. Some plots relating to this method
and some analyses of several samples are presented in Figures 5.26 and 5.27.
The two plots in these figures are of PCA scores (T1 vs. T2, and T2 vs. T3).
From these, some samples were identified as forming clusters, and were
investigated further.


Search WWH ::

Custom Search