Biomedical Engineering Reference
In-Depth Information
0.45
0.40
0.35
0.30
0.25
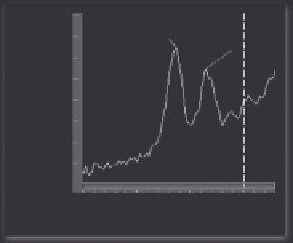
Row = 77 Col = 73
1654.920
1543.049
Band shift of amide I band between
1700-1600 cm
-1
.
0.20
0.15
0.10
1800
1600
Wavenumber
1400
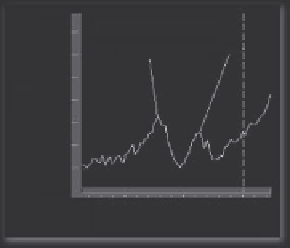
Row = 18 Col = 75
1689.639
0.35
0.30
0.25
0.20
0.15
0.10
0.05
1546.907
e image above is obtained by a mosaic
of an area measuring 1.4 × 1.4 mm.
1800
1600
1400
Wavenumber
Figure 5.18
FTIR spectra of cancerous tissue, amide I band of cancer, and normal tissue.
group simpler. The peak centred at 1632 cm
−1
is due to bonded C=O and the
band at 1538 cm
−1
confirms the presence of C-N-H moieties, see Figure 5.18.
Monosubstituted amides usually exist with the -NH and C=O bonds. The
hydrogen bonded stretch is seen near 3290 cm
−1
with a weaker band near
3070 cm
−1
assigned to a Fermi resonance-enhanced overtone of the 1536 cm
−1
band. This band at 1536 cm
−1
involves both C-N stretch and C-N-H in-plane
bend in the amide II band. This band is a characteristic of monosubstituted
amides. Amide III bands absorb more weakly and are confirmed by the pres-
ence of peaks at 1310 and 1235 cm
−1
. A band centred at 1160 cm
−1
is due to
C-O stretching modes of the C-OH of cell proteins and the C-O group of
carbohydrates.
Spectral bands in the region of 1700 to 900 cm
−1
arise from C=O, CH
2
,
CH
3
, C-O-C, and O-P-O groups, confirming the presence of phospholip-
ids, proteins, carbohydrates, collagen, and amino acids. Differences between
normal and cancerous tissues spectra are observed. Spectra of normal and
breast cancer tissue are complex and possess well-defined and promi-
nent spectral bands at the 1700 to 700 cm
−1
and 3500 to 2700 cm
−1
regions.
Difference in intensity and positioning of peaks in the spectra are attributed
to the compositional changes between the normal and cancer tissues.
The intensity increase of the C-H peaks may be attributed to the increase
in the lipids, proteins, and DNA contents indicating the increment of fatty


Search WWH ::

Custom Search