Biomedical Engineering Reference
In-Depth Information
0.6
A
0.5
0.4
0.3
0.2
0.1
0.0
1800
1600
Wavenumber, cm
-1
1200
1400
1000
800
0.7
B
164
1630
0.6
1542
0.5
1522
0.4
0.3
0.2
0.1
0.0
1700
1600
1500
1400
Wavenumber, cm
-1
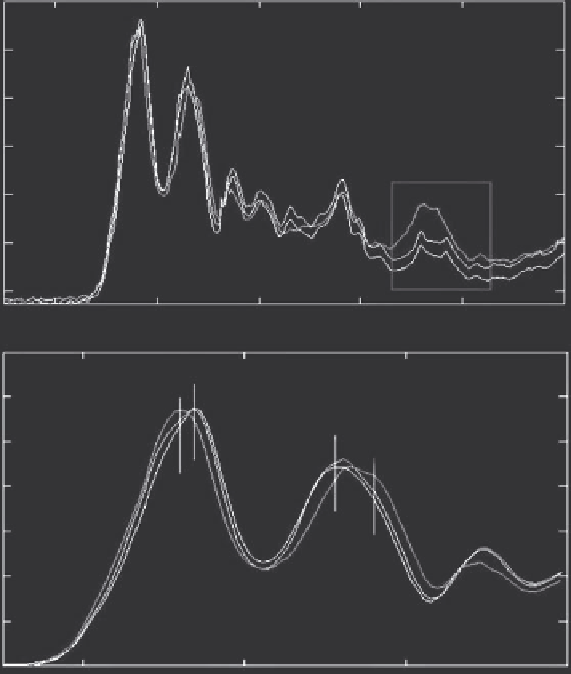
Figure 5.15 (See colour insert.)
A: FTIR spectra of sections from DCIS,
(LNG in black, ING in blue, and HNG in red). B: Variation
in intensity of the peaks in the spectral region 1700-1400 cm
−1
.
This is due to the fact that the infrared absorption band for amide I groups
is sensitive to protein conformation; therefore, this band can be employed to
grade the DCIS tissue, in addition to relative intensities.
In the amide I and II area, a pattern similar to IDC samples was observed in
DCIS samples (Figures 5.15B and 5.13B). In both cases, whilst amide I upshifts
toward 1640 cm
−1
, amide II downshifts to 1522 cm
−1
, indicating secondary
structure alterations.
The presence of peaks centred at 1310-1300 cm
−1
(amide III band of pro-
teins) [46], in the 1700-900 cm
−1
region can be attributed to type I collagen
(Figure 5.15 and 5.16C). The difference in intensity and shape of these peaks
indicates the varying type and amount of type I collagen present in the
three nuclear-grade tissues (Figure 5.16C). Therefore, combining the three
Search WWH ::

Custom Search