Biomedical Engineering Reference
In-Depth Information
A
0.25
1055
997
890
765
III
0.20
0.15
0.10
II
I
0.05
0.00
Grades
B
0.06
III
1713
1673
1656
1496
0.05
0.04
0.03
II
I
0.02
0.01
0.00
Grades
C
0.06
2920
2896
2862
2850
0.05
0.04
0.03
0.02
0.01
0.00
Grades
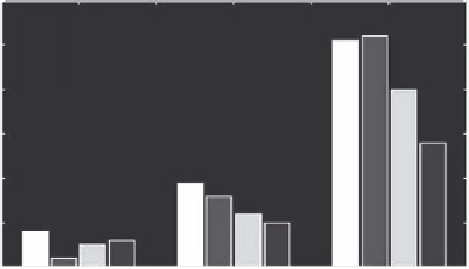
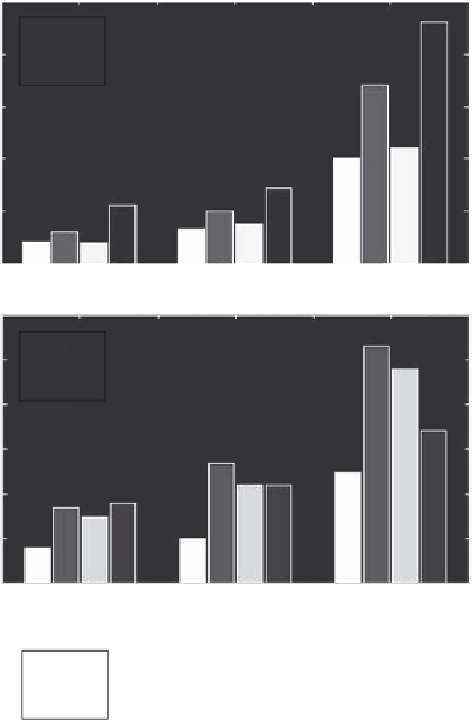
Figure 5.14
A: Plots of amplitudes of selected peeks from the new group of bands at 1055, 997, 890, and 765
cm
−1
appear and display a steady rise as the cancer progresses from Grade I to III. B: Plots of
amplitudes representing the quantitative analysis of amide I and amide II regions in different
cancer grades. C: Plots of the amplitudes of the gradual alteration in CH content in different
cancer grades.


Search WWH ::

Custom Search