Biomedical Engineering Reference
In-Depth Information
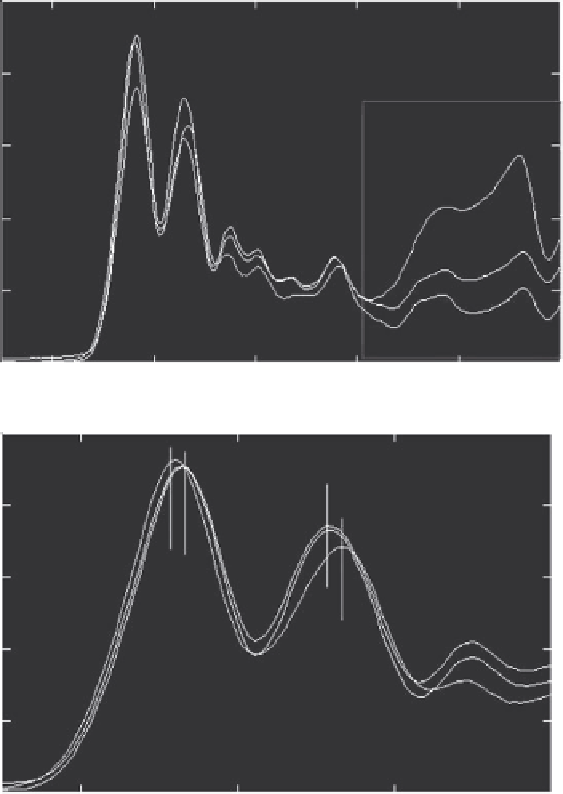
FTIR Differences among IDC Grades (I, II, and III)
The most dramatic changes in the FTIR spectra of cancerous tissues occur
in the spectral range of 1100 to 1000 cm
−1
(phosphodiester stretching bands
region) [48,49] and show significant differences between the spectra of IDC
grades, as peak positioning is shifted in addition to changes in absorbance of
the peaks (Figure 5.13, outlined, boxed area). This indicates that the chemical
0.5
A
0.4
0.3
0.2
0.1
0.0
1800
1600
1400
Wavenumber, cm
-1
1200
1000
800
0.5
B
1640
1630
1542
0.4
1522
0.3
0.2
0.1
0.0
1700
1600
Wavenumber, cm
-1
1500
1400
Figure 5.13 (See colour insert.)
A: FTIR differences among IDC grades (I, in black; II in blue; and III, in red). B: Peak shifting in
protein amide I and II regions.
Search WWH ::

Custom Search