Biomedical Engineering Reference
In-Depth Information
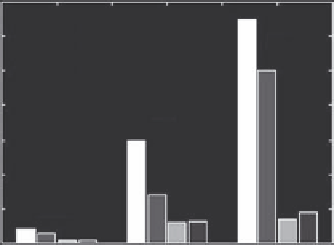
A
0.14
0.12
2880
2851
1955
1662
HNG
0.10
0.08
ING
0.06
0.04
0.02
LNG
0.00
Grades
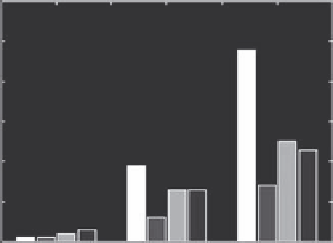
B
0.06
1442
1260
992
780
HNG
0.05
0.04
0.03
ING
0.02
0.01
LNG
0.00
Grades
Figure 5.8
Plots of the amplitudes of selected peaks, from the Raman difference spectra presented as a
function of the DCIS grade of breast tissues.
the microscope. This ATR objective provides two modes of operation; one
is for viewing the specimen and the other for IR analysis. The view mode
allows viewing of the area of interest and the IR mode for spectral data
acquisition. A zoom on aperture was used to mask areas of interest. Spectra
were obtained from three different areas at 4 cm
−1
resolution, averaging
256 scans for each region.
Figure 5.9 shows the FTIR spectra of normal, DCIS (HNG), and IDC (GIII)
breast tissues. Figure 5.10 represents the FTIR spectra of different IDC
grades, and Figure 5.11 shows the FTIR spectra of different DCIS grades of
breast tissue.
A summary of the peak assignments and definitions is presented in
Table 5.3.
FTIR Differences among Normal, DCIS, and IDC
FTIR spectra of normal breast tissue, cases of HNG, DCIS, and a case of GIII
IDC are given in Figure 5.12. The most noticeable feature of each spectrum is
the complexity, with prominent absorption in almost all regions of the spectra.


Search WWH ::

Custom Search