Biomedical Engineering Reference
In-Depth Information
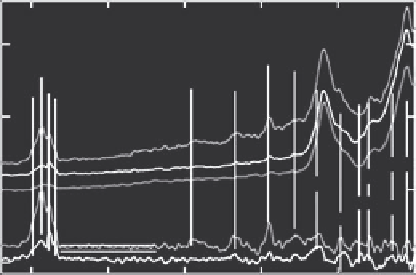
Raman Differences among Normal, DCIS, and IDC Tissues
Raman spectra of normal breast tissue, a case of DCIS HNG, and a case of
IDC GIII are shown in Figure 5.4. The most notable feature of each spectrum
is the well-defined peaks in the 1800-550 cm
−1
region of the spectra. Obvious
spectroscopic differences exist in both the absolute and relative intensities of
the peaks in the spectra (bottom traces).
The peak present at 1662 cm
−1
in the spectrum of normal breast tissue is
due to amide I band of tissue proteins [19-22]. These bands are highly sensi-
tive to the conformational changes in the secondary structure. The amide I
band is due to the in-plane stretching of the C=O bond of the peptide back-
bone [22], weakly coupled to stretching of the C-N and in-plane bending of
the N-H bond [21]. A noticeable point about this peak is the fact that it has
been used the most for structural studies because of its high sensitivity to
small changes in molecular geometry and hydrogen bonding of the peptide
group [22]. The intensity of the bands varies with the degree of fatty-acid
unsaturation and depends on the lipid to protein ratio. The peak located at
1442 c m
−1
is a protein assignment attributed to
ν
(CH
2
) and
ν
(CH
3
) of collagen
[23], or a lipid assignment attributed to
ν
(CH
2
), scissoring, phospholipids [23],
and is of diagnostic significance [24]. The spectral differences in the regions
960-800 cm
-1
and 1400-1080 cm
−1
further confirm the increase of protein con-
tent and relative decrease in the lipids/acylglyceride content in the cancerous
tissues. The bands at 1662, 1442, and 1260 cm
−1
are due to β-sheet structure
of amide I[21], arising from C=O stretching vibrations of collagen and elas-
tin [23,25] and C=C of lipids [26]; CH
2
scissoring and CH
3
bending in lipids
1.5
1442
1662
1260
2930
2959
2880
1955
2851
1.0
540
780
850
992
1096
0.5
650
0.0
3000
2500
2000
1500
1000
500
Wavenumber/cm
-1
Figure 5.4 (See colour insert.)
Raman spectra of normal (red), DCIS (HNG) (blue), and IDC (GIII) (black) breast tissues.
Bottom traces are differences between IDC (black) and control, and DCIS (blue) and control
tissues. For calculating the differences, spectra have been normalised to the peak at 1093 cm
-1
.
Horizontal double lines indicate the level of noise in order to facilitate justification of peak
significance.
Search WWH ::

Custom Search