Biomedical Engineering Reference
In-Depth Information
The low laser power in the Raman spectrophotometer makes it possible to
analyse biological tissues without the loss of sensitivity due to fluorescence
of organics.
The tissue samples were analysed by mounting them on slides. The spec-
tra were obtained by using 4 exposures, 16 scans, and at 4 cm
−1
resolution.
The tissue samples were mapped across the section.
Infrared spectra were obtained using a Nicolet 800™ spectrometer in
conjunction with a Nicplan™ microscope equipped with a liquid nitrogen-
cooled MCTA detector. An attenuated total reflectance (ATR) slide on objec-
tive equipped with diamond crystal (Spectra-Tech™, USA) was mounted on
the microscope. This ATR objective provides two modes of operation; one
is for viewing the specimen and the other for infrared (IR) analysis. The
view mode allows viewing of the area of interest and the IR mode allows
spectral data acquisition. A zoom on aperture was used to mask areas of
interest.
Spectra were obtained at 4 cm
−1
resolution, averaging 256 scans. Three
randomly selected spots were analysed for each specimen taking fifteen
spectra for each tissue. Spectra of the normal tissues were also obtained for
comparison.
In this study, the spectra were obtained by using 4 exposures, 16 scans,
and 4 cm
−1
resolution. The tissue sample was mapped across the section.
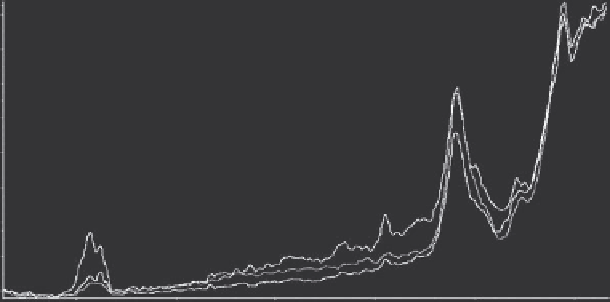
Figure 5.1 shows the Raman spectra of normal, DCIS (HNG), and IDC
(GIII) breast tissues. Spectra of IDC grades (GI, GII, and GIII) are shown in
Figure 5.2, and the spectra of DCIS grades (HNG, ING, and LNG) appear in
Figure 5.3.
Raman spectroscopy has the potential to identify markers associated with
malignant changes. Normal and neoplastic tissues have distinct biochemical
0.9
Red
: Normal breast tissue
Black
: IDC Grade III
Blue
: DCIS-HNG
0.8
0.7
0.6
0.5
0.4
0.3
0.2
0.1
3000
2500
2000
Raman Shift (cm
-1
)
1500
1000
500
Figure 5.1 (See colour insert.)
Raman spectra of normal, DCIS (HNG), and IDC (GIII) breast tissues.
Search WWH ::

Custom Search