Geoscience Reference
In-Depth Information
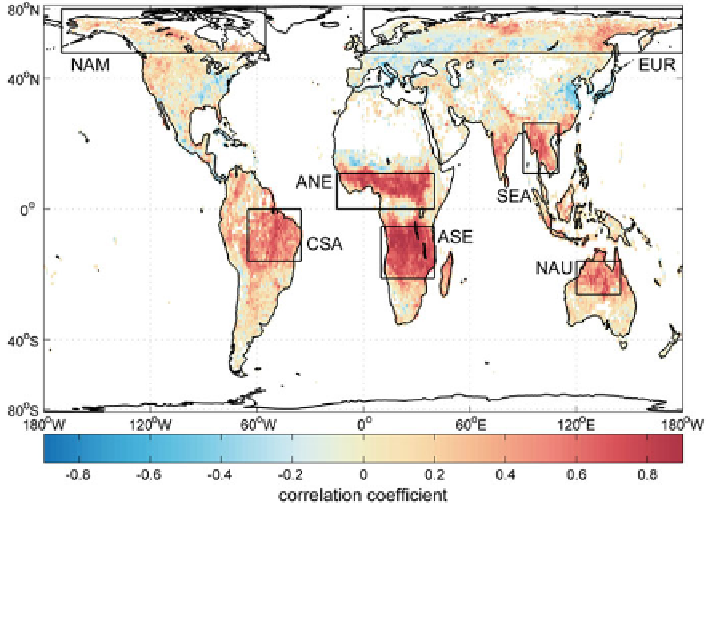
Fig. 1
Correlation coefficients (r) of the temporal relationship between TVC NO
2
and FRP based
on monthly averages from 2007
grid. Schreier et al. (
2014a
) have derived FERs
of NO
x
for the tropical and subtropical regions ANE, Africa south of Equator (ASE), central South
America (CSA), northern Australia (NAU), and southeast Asia (SEA). The boreal regions Eurasia
(EUR) and North America (NAM) were the focus of Schreier et al. (
2014b
)
2012 on a 1
×
1
°
-
five tropical and sub-
tropical and two boreal regions (see Fig.
1
) as well as for eight different land cover
types as de
The evaluation of FERs of NO
x
has been carried out for
ned by the UMD classi
cation scheme (see Schreier et al.
2014a
,
b
).
fits of the linear regression are shown for different types of open
biomass burning within Africa north of Equator (ANE).
The calculated FERs of NO
x
for the other selected biomes and regions are reported
in Schreier et al. (
2014a
,
b
) and possible uncertainties are discussed in detail.
In order to make the satellite-derived EFs comparable to the values reported in
the emission factor compilations by Andreae and Merlet (
2001
) and Akagi et al.
(
2011
), the EFs of NO
x
are derived for tropical forest (evergreen broadleaf forest),
savanna and grassland (open shrublands, woody savannas, and savannas), crop
residue (croplands), and boreal forest (evergreen needleleaf forest, deciduous nee-
dleleaf forest, mixed forest, and woody savannas).
Figure
3
provides the arithmetic means of EFs as obtained from satellite data as
well as arithmetic means of EFs reported by Andreae and Merlet (
2001
) and Akagi
et al. (
2011
). While the error bars denote one standard deviation of the arithmetic
mean in the two latter studies, they indicate the minimum and maximum values
obtained for the different regions as highlighted in Fig.
1
. The satellite-based EFs of
In Fig.
2
, typical
Search WWH ::

Custom Search