Geoscience Reference
In-Depth Information
10
−
5
km
−
1
are shown in gray. The
black contour lines indicate the ERA-Interim zonal wind lower or equal
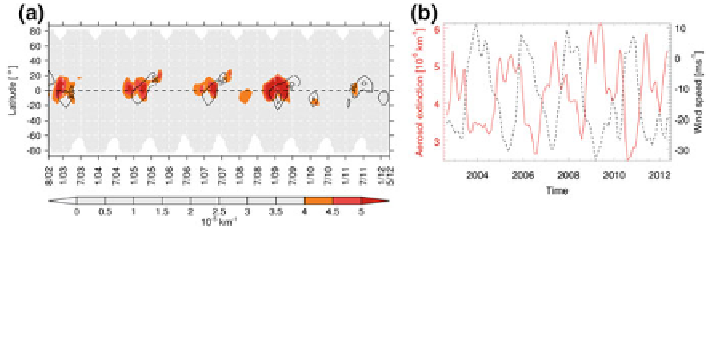
Fig. 4 a The same as Fig.
1
, but all extinctions lower than 4
×
30 m/s at a pressure level
of 10 hPa. b Time series of the zonal monthly mean aerosol extinction at 30 km in red and time
series of the zonal-mean zonal wind at 10 hPa (
−
31 km). Both panels show the correlation between
maximum easterly winds and maximum aerosol load at about 30 km altitude
≈
September 2010 and does not end by the end of the time series. Hence, these last two
westerly phases are longer than the
first three westerly phases of the time series.
Furthermore, at pressure levels near 8 hPa, the zonal-mean zonal winds showwesterly
winds of the semi-annual oscillation (SAO, a dominant variability mode in the
mesosphere and upper stratosphere (e.g., Baldwin et al.
2001
)), which reach in 2009
and 2011 relatively low altitudes compared with the years 2003
2008. The high
aerosol load around January 2009 results from the strong easterly wind around 10 hPa
in combination with the wind transition at about 20 hPa. These two features provide
optimal conditions for high aerosol loads around 30 km. Shortly afterwards, the wind
transition line sinks down to 40
-
50 hPa and the mentioned SAOwesterly winds occur
at 8 hPa. The combination of these two features, in contrast, leads to descent around
10
-
20 hPa, because the SAO induces a westerly shear and thus a reduced aerosol load
at 30 km altitude. Almost the same happens in 2011 in addition to a relatively short
time slot (Jan
-
May 2011) for an aerosol increase at 30 km. These observations explain
that in 2011 the aerosol layer does not reach the same level of extension as in the years
2003, 2005, 2007, and 2009. Moreover, the delay of the last equatorial aerosol
maximum in the sequence of biennially enhanced aerosol extinction results from the
mentioned longer westerly phase ending in February 2010.
-
4 Conclusions
The ten-year SCIAMACHY limb stratospheric aerosol data record provides
information about the variability of the global stratospheric aerosol load from the
tropopause up to about 33 km with a vertical resolution of about 4 km. The analysis
presented in this study is based on gridded aerosol extinction coef
cients at 750 nm
wavelength of the retrieval version 1.1. We focused on the tropical aerosol distri-
bution at 30 km altitude, which shows variability on a biennial
timescale. In
Search WWH ::

Custom Search