Geoscience Reference
In-Depth Information
I
n
589
ð
:
0nm
;
TH
i
Þ
y
ð
TH
i
Þ
¼
1
exp
½
2
ð
ln I
n
ð
525 nm
;
TH
i
Þþ
ln I
n
ð
675 nm
;
TH
i
ÞÞ
In the UV spectral range the method described by Rohen et al. (
2006
) is used.
The measurement vector, y, was originally obtained from the normalized limb
radiance pro
les at eight single wavelengths (264, 267.5, 273, 283, 286, 288, 290.5,
and 305 nm) (Sonkaew et al.
2009
). These wavelengths are chosen to avoid strong
Fraunhofer lines and terrestrial airglow emissions. The SCIAMACHY limb ozone
pro
rst
order Tikhonov regularization (Rozanov et al.
2007
,
2011
). The forward modelling
is done with the radiative transfer model SCIATRAN (Rozanov et al.
2014
).
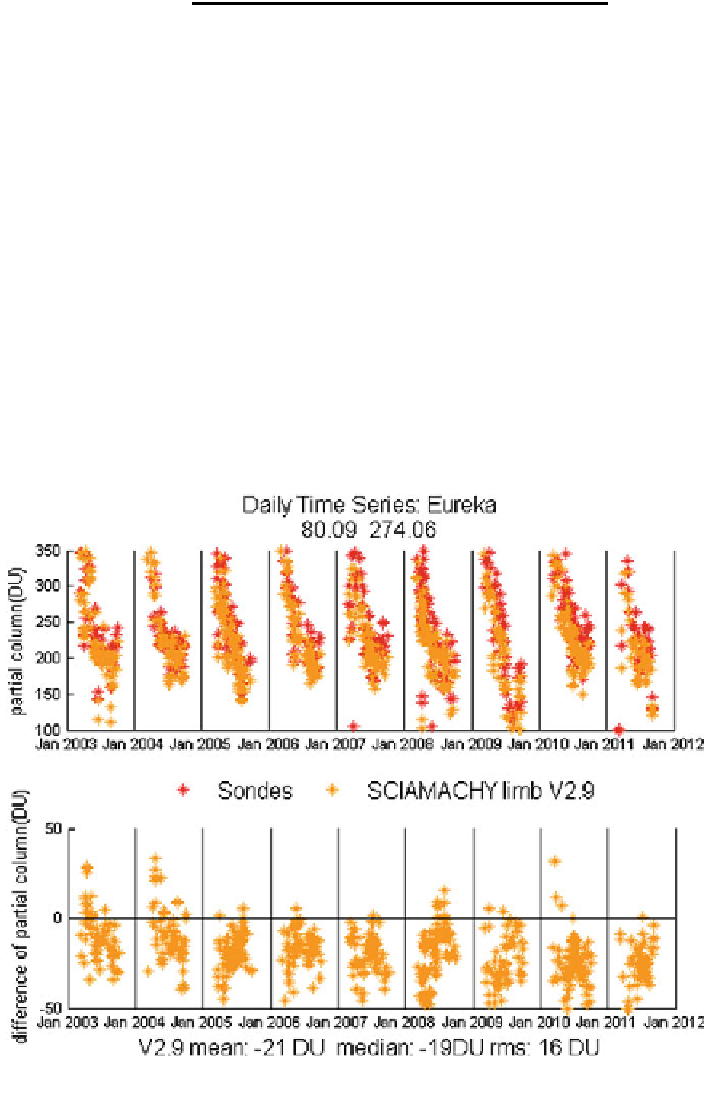
A comparison of SCIAMACHY SPO V2.9 with ozone sonde data from Eureka
(80.1
les are then retrieved by using a non-linear inversion scheme with the
W) is shown in Fig.
2
. Similar seasonal variations are observed in the
time series from both SCIAMACHY and sonde data (upper panel). This annual
variation is the result of chemical and dynamical processes (Chipper
°
N, 85.9
°
eld et al.
1999
). The Brewer-Dobson circulation causing the diabatic descent of ozone rich
air in the high latitudes is most ef
cient in winter. As a result, the lower strato-
spheric ozone steadily increases over winter and reaches its maximum in March
Fig. 2 SPO time series from SCIAMACHY V2.9 limb data and ozone sonde data (upper panel)
and the absolute difference in SPO (lower panel) for Eureka (80.1
°
N, 85.9
°
W)
Search WWH ::

Custom Search