Geoscience Reference
In-Depth Information
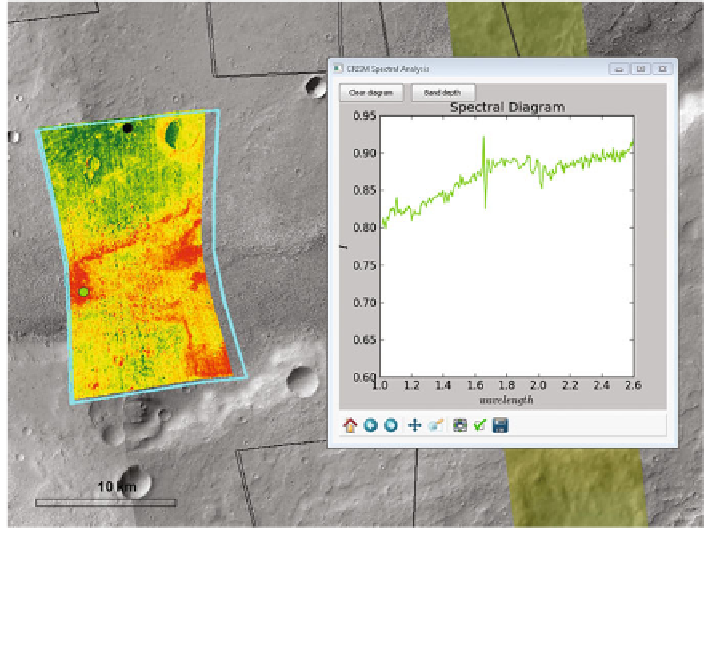
Fig. 4 ArcGIS screenshot showing a color-coded CRISM hyperspectral olivine summary
parameter map (red is possibly high in olivine, green is low) on top of 6 m/pixel CTX data. The
green dot on the map is the location of the spectrum shown in the ArcGIS PlanetServer add-in
CRISM spectral analysis window. By comparing with known mineral spectra the spectrum can
subsequently be interpreted
This allowed for regional-scale features to be mapped, such as the graben structures
and
(in the THEMIS IR day-time) deposits (DTD), previously partially
mapped by Rogers and Nazarian (
2013
). Progressively, higher detail was added by
producing multiple CTX mosaic tiles: 20 tiles were created covering graben
structures of interest.
The mineralogical investigation started at regional scale by observing the MRDR
summary product of the mineral olivine: various mapped DTD proved to be olivine-
rich. The CRISM hyperspectral data covering the various DTD were investigated
for olivine using the ArcGIS PlanetServer add-in. Locations of possible hydrated
minerals detected by Carter et al. (
2013b
) and Ehlmann et al. (
2012
) were also
further investigated. It was found that 6 of the localities detected by Carter et al.
(
2013b
) were located on top of graben escarpment rims (Fig.
3
). During the earlier
explorative phase of the investigation, CTX mosaics
'
dark toned
'
'
tiles
'
were
first produced for
the areas covering these localities.
A graben associated with three hydrated mineral detections (Fig.
3
b) was chosen
for further investigation using CTX and CRISM. The CRISM MRDR olivine
summary parameter showed olivine signatures on the graben
oor. A custom
ArcGIS PlanetServer add-in was subsequently used to investigate the spectra and
fl
Search WWH ::

Custom Search