Geoscience Reference
In-Depth Information
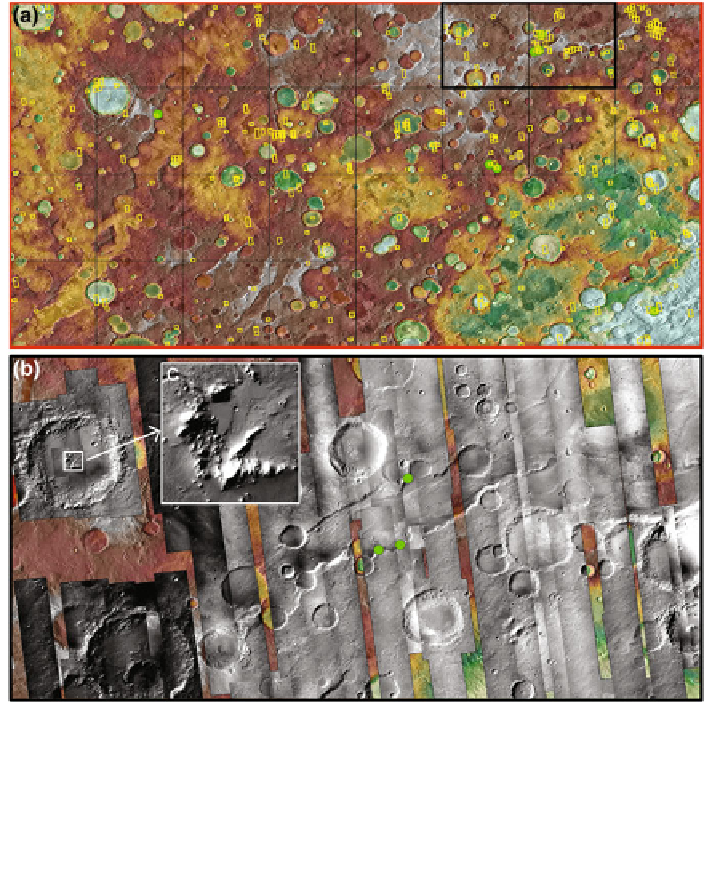
Fig. 3 The case study region of interest in Noachis Terra. The background is semi-transparent
THEMIS IR daylight imagery overlaying color-coded MOLA elevation data. The green dots are
the 6 locations of the Carter et al. (
2013b
) hydrated mineral detections. a The 20 MRDR tiles are
shown as black rectangles. The yellow polygons are the
of the CRISM TRDR
hyperspectral data. The thick rectangle shows the extent of (b). b Two CTX MRDR tile mosaics
showing three Carter et al. (
2013b
) hydrated mineral detections. c An example of the CTX data at
the full 6 m/pixel scale
'
footprints
'
calibration, georeferencing and mosaicking of the CTX data using 12 cores in
parallel. The CTX were mosaicked into square regions with the same extent as the
CRISM MRDR tiles. 20 of these mosaics were created for the Noachis Terra region
(Fig.
3
). A custom built python script created the
'
blackpearl
'
and ISIS3 con
gu-
ration
files for each tile mosaic. The 20 mosaics were made available online as
MapServer WMS services on PlanetServer (total 81 GB as GeoTIFF
files) and
of
ine as JPEG2000 compressed raster data (total 9 GB).
Next to CTX and CRISM data also Mars Orbiter Laser Altimeter (MOLA, on
board the NASA Mars Global Surveyor satellite) GIS-ready gridded (463 m/pixel)
fl
Search WWH ::

Custom Search