Geoscience Reference
In-Depth Information
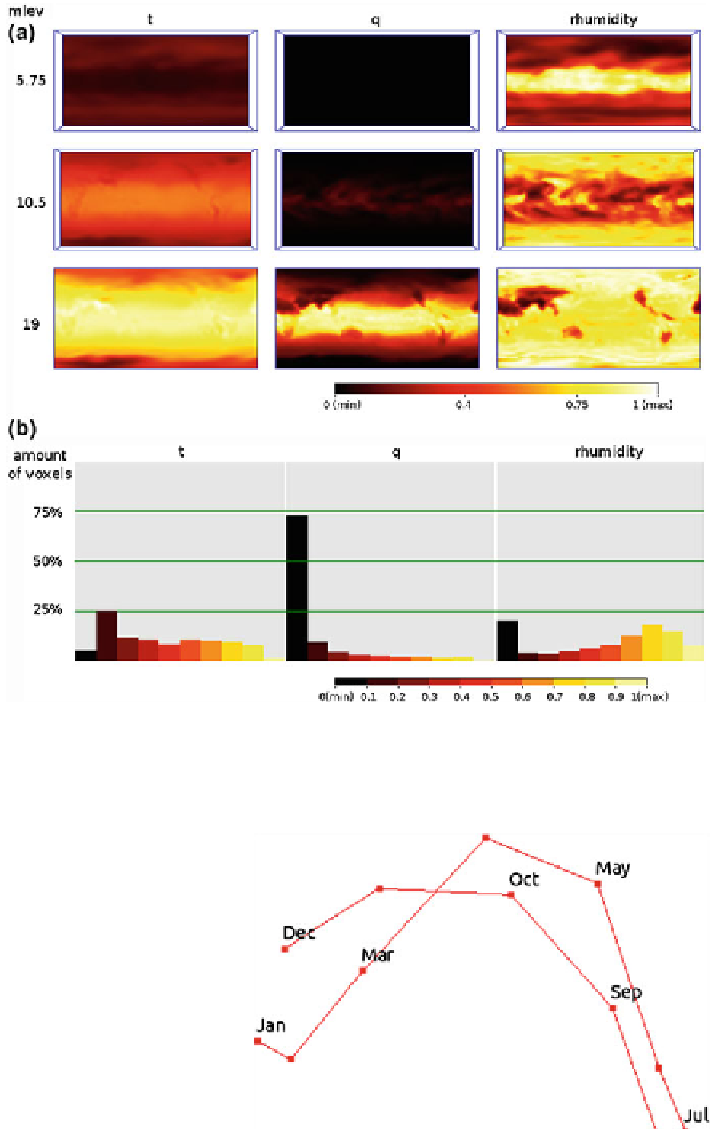
Fig. 3 Individual views for outliers among original
fields in Fig.
1
: temperature t, speci
c
humidity q, and relative humidity rhumidity. a Slice views, mlev is the interpolated layer index of
the slice (1
—
top layer, 19
—
surface layer). b 1D histograms
Fig. 4 The
field similarity
plot for twelve months of the
temperature
field. Yearly
cycle is clearly visible,
separating months in three
groups: winter, summer, and
transitional seasons
Search WWH ::

Custom Search