Geoscience Reference
In-Depth Information
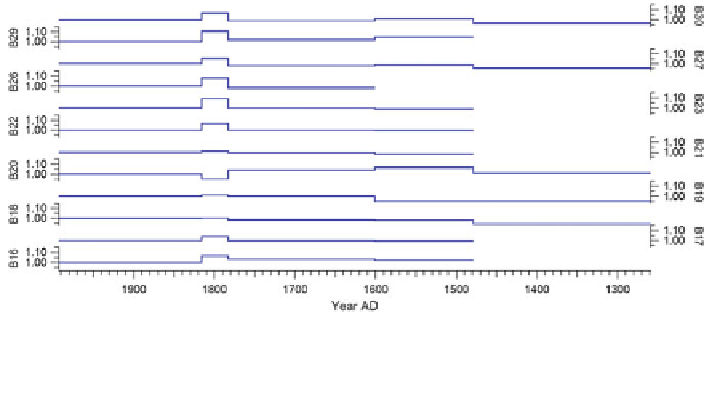
Fig. 4 Relative changes in the accumulation rates for periods between well dated volcanic
eruptions (Tambora 1816; Laki 1783; Huyanaputina 1601; Mt. St. Helens 1479; unknown 1259).
Reference for each core is the mean accumulation rates over the period between 1816 and present
(1993
-
1995)
Laki and Tambora eruptions (1783
-
1816) the accumulation rates do not show any
signi
cant changes during the entire period of the last millennium. The changes are
mostly around 1 % but never exceed 5 % relative to the mean since the Tambora
eruption (1816
1993).
-
4 Discussion and Conclusion
The accumulation rates derived from 12 shallow ice cores in northern central
Greenland indicate only little variability over the past millennium. The changes are
generally less than 10 % for all sites. Except for the short period between the Laki
and Tambora eruptions (1783 and 1816, respectively) the accumulation rates do not
show clear trends, however, these changes may be caused by the shortness of this
time period.
Our mean accumulation rates agree well with the results of Benson (
1962
) and
Bales et al. (
2009
). Compared to our accumulation rates the values presented in the
map of Ohmura and Reeh (
1991
) seem to overestimate the accumulation in central
parts of North Greenland between 10 and up to more than 30 % (Fig.
5
).
In future work the causes of these differences have to be investigated in more
detail. They may be explained by the different interpolation techniques or differ-
ences in accumulation rates on shorter distances.
A direct comparison to the accumulation rates obtained by Box et al. (
2013
)is
not possible as no details about regional distribution is given.

Search WWH ::

Custom Search