Geoscience Reference
In-Depth Information
(a)
(b)
obs.
obs.
(c)
(d)
obs
obs.
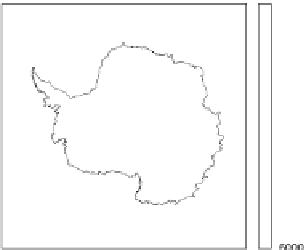
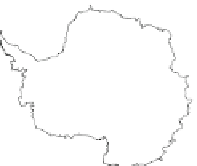
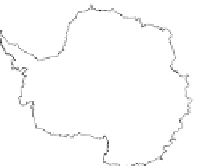
Fig. 3 Climatological and topographic forcings taken from observations used in the PD run.
a Depicts the bedrock topography which was kept constant throughout the experiment (no visco-
elastic response from the Earth
flux distribution, c annually averaged
accumulation based on (Arthern et al.
2006
), d surface temperature
field, a, b and d from
ALBMAP data set (Le Brocq et al.
2010
)
'
s mantle), b geothermal heat
fl
which equilibrium ice volume corresponds to the PD ice volume within one per-
cent. Regardless of the good match of equilibrium volume, there are large dis-
crepancies in ice thickness distribution. The East Antarctic Ice Sheet generally
looses ice mass due to the low accumulation and out
low along the topographic
gradient. The area around the Amery Ice Shelf gains considerable mass and hence
increased ice thickness. This is due to the coarse 40 km resolution and the narrow
topographic trough underneath the Amery shelf (represented in the model by 5 grid
points or 200 km at the shelf front and narrowing to 1 grid cell or 40 km around the
grounding line). This leads to a strong decrease in ice
fl
fl
ow, and subsequent
accumulation of ice mass.
2.2 Passive Tracer Advection
There are two widely used methods of transporting passive tracers in numerical
simulations both implemented in the tracer advection model discussed below.


Search WWH ::

Custom Search