Geoscience Reference
In-Depth Information
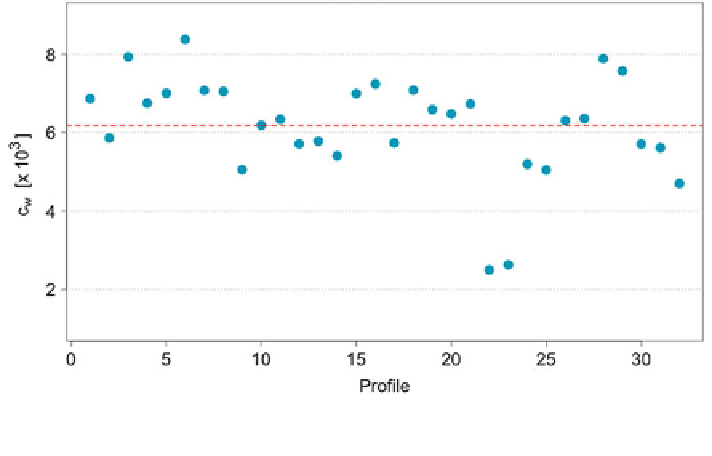
Fig. 3 Values of the oceanic drag coef
cients c
w
calculated for the Central Arctic. The red line
represents the mean value
With this information we can calculate the drag coef
cients for each pro
le. The
results are shown in Fig.
3
.
Only a few measurements of oceanic drag coef
cients are available for com-
paring the results obtained with Eqs.
2
and
3
. Lu et al. (
2011
) showed (see their
Table 1) that oceanic drag coef
10
−
3
.
Our calculated values lie within this range. We stress that the oceanic drag coef-
10
−
3
to even 22
cients can vary from 1
×
×
ficients vary strongly with the sea-ice topography and that the choice of a constant
value used in global circulation models might imply a bias in the estimation of the
momentum exchange between the ice and the ocean.
4 Ekman Pumping
Ekman pumping in the ocean depends on the spatial variation of the stress applied
at the surface. This spatial variation is a consequence of variations in both the
velocity
cients. In this section we want to evaluate the
contribution to Ekman pumping that is caused only by variations of the drag
coef
field and the drag coef
cients. We thus set up a very simple experiment. 32 grid cells aligned along y,
each 20 km wide, form a domain of 20 km
640 km. This domain is covered
completely with sea ice (100 % sea-ice cover). The surface and bottom properties of
the ice are varying from one cell to the other, so that the drag coef
×
cients are also
different. In particular, to each grid cell we assign a value for the drag coef
cient
that was calculated (see Sect.
3
) on the basis of real sea-ice topography. We assume
Search WWH ::

Custom Search