Geoscience Reference
In-Depth Information
Two sensitivity tests were performed: task (a) to assess the importance of the
latitude were the dense water plume is formed and task (b) to study the effects of
initial density on the spreading of the plume. All simulations start on the
first day of
June and run for 8 months with a 6-minutes time-step. In each case, a plume source
occupying half of the water column was placed on the continental shelf for 2
months. Afterwards the integrations continued without any further adjustments. The
plumes were marked with a passive tracer.
For the
first task two experiments were carried out: the dense water source was
placed where (a) the former LIS A and B were located (experiment L1) and (b) in
front of LIS C (L2). The temperature (
C) and salinity (34.64) values used
were obtained from observations (station 301 in Absy et al.
2008
).
The second task consisted of two experiments with the plume starting at the
same position of L2. In the
1.92
°
−
σ
0
) was reduced from
27.89 kg/m
3
, L1 and L2, to 27.73 kg/m
3
using an increased temperature (
first run, the density of the water (
C)
and lower salinity (34.45) (S1). In the second simulation the density was raised to
27.97 kg/m
3
by increasing the salinity to 34.75 (S2).
1.69
°
−
3 Results
The plume starting at L1 leads to a major
eld Strait (BS) (Fig.
1
).
The spreading path bifurcates at the tip of the AP. The southern branch
fl
flow into Brans
ows
southwest along the Strait southern slope of BS and then turns north-northeast to
spread along the opposite margin. This path agrees well with the circulation scheme
fl
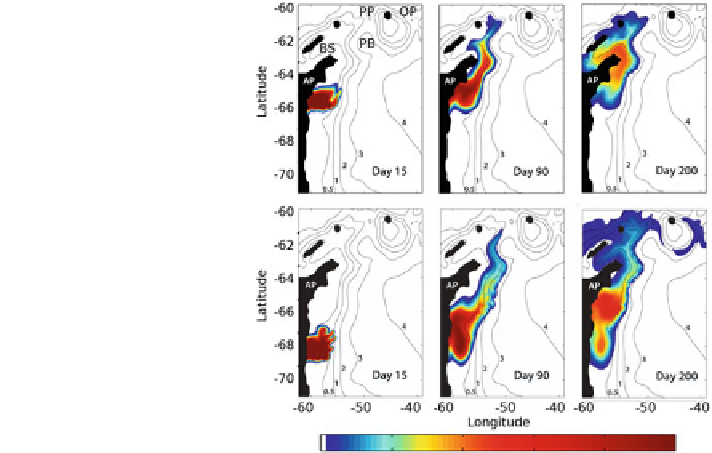
Fig. 1 Tracer concentration
in simulations L1 (upper
panels) and L2 (lower panels)
after 15 (left), 90 (middle) and
200 (right) days. The
abbreviations in the upper left
panel represent Bransfield
Strait (BS), Orkney Passage
(OP), Powell Basin (PB), and
Philip Passage (PP)
Search WWH ::

Custom Search