Geoscience Reference
In-Depth Information
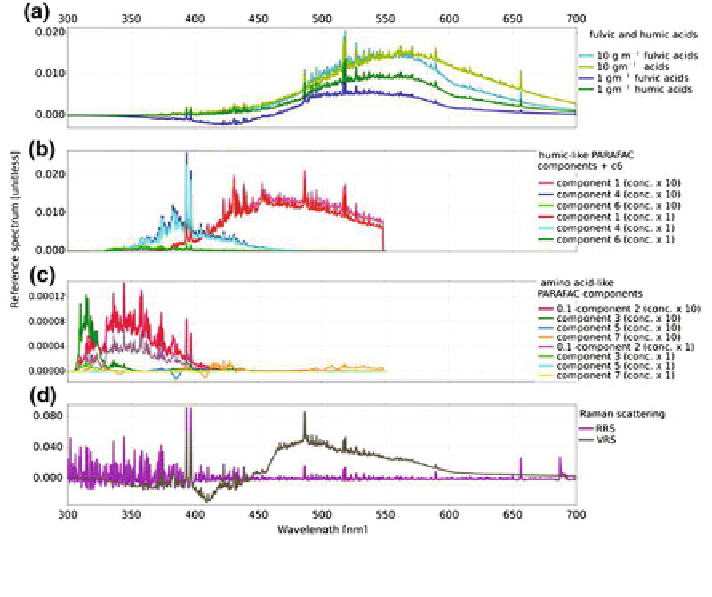
Fig. 3 Calculated reference spectra for: a fulvic and humic acids (Hawes
1992
), b, c PARAFAC
components (J
ø
rgensen et al.
2011
) d RRS and VRS
Amino acid-like components exhibit the
fl
fluorescence excitation at shorter wave-
lengths, usually below 300 nm (J
rgensen et al.
2011
). Due to this, when it is
measured with active techniques, the
ø
fluorescence signal is strong; however, it is
much weaker in natural conditions as there is little electromagnetic radiation
reaching the ocean surface in this wavelengths region. One reason is the shape of
the solar spectrum, which has its maximum irradiance in longer wavelengths near
500 nm, and is rapidly decreasing towards shorter wavelengths. The second reason
is the strong absorption of ozone in the UV region. Humic-like components of
CDOM show stronger
fl
fluorescence features under natural conditions, as their
excitation spectral region is in longer wavelengths, above 300 nm, where more light
is available in the water column.
The spectral shape of humic-like PARAFAC components differs signi
fl
cantly
from the spectra of humic acids obtained using the Hawes (
1992
) approach
(Fig.
3
a). In case of the latter, their
fluorescence emissions start in longer wave-
lengths and reach further up to 700 nm, which is not the case for the PARAFAC
measurements. This difference is probably due to the techniques used by Hawes
(
1992
) to separate and measure humic and fulvic acids absorption and
fl
uorescence.
It was shown in previous studies that CDOM extracted with C-18 cartridges (which
were used in this case) did not always retain the optical properties of the original
fl
Search WWH ::

Custom Search