HTML and CSS Reference
In-Depth Information
If you want to test your pages in Internet Explorer, Opera, and Safari, the solution is
Firebug Lite, a JavaScript file you can insert into your pages to simulate some Firebug
features in browsers that are not named Firefox. Firebug Lite creates the variable “fire-
bug” and doesn't affect or interfere with HTML elements that aren't created by itself. Go
to
http://getfirebug.com/
for more information.
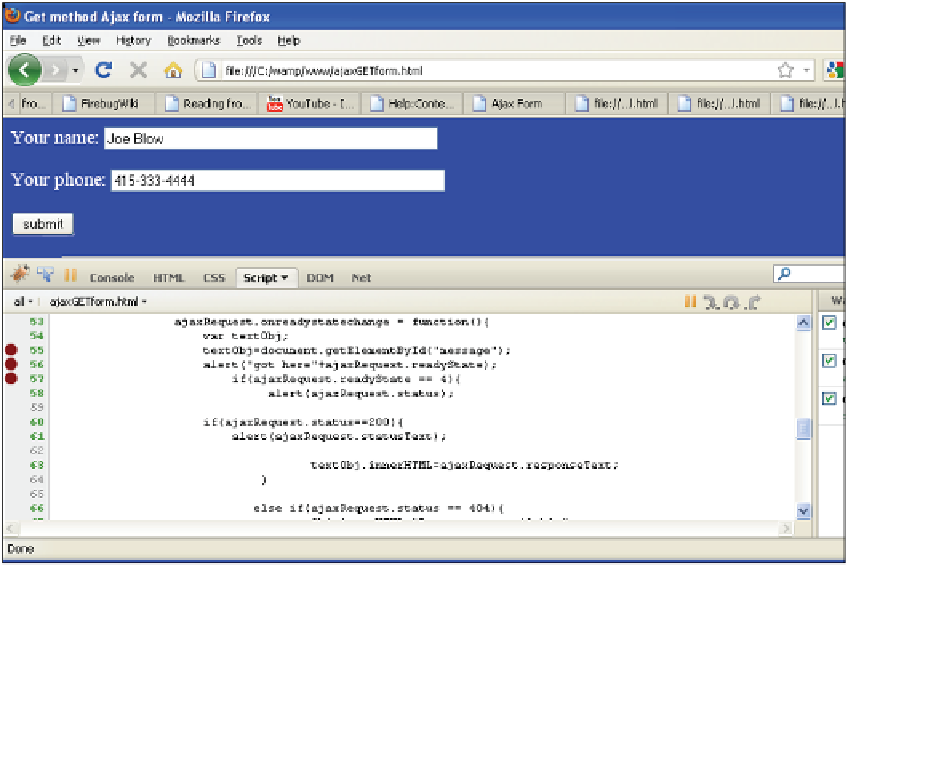
Figure 18.27 shows Firebug in its own window with breakpoints. The yellow arrow
on the left is the line that is currently executing. The problem: Firefox returns an HTTP
status of 0 instead of 200. By placing the cursor on the status variable, Firebug will show
that the value is 0. The pane at the bottom of the Firebug window monitors the value of
variables, breakpoints and the state of the program's stack. The little blue arrow to the
left of the Console tab lets you step through the program one line at a time. The red dots
to the left of the program are breakpoints obtained simply by clicking on a line number.
Firebug comes with full documentation and there are a number of tutorials on the Web
to help you understand how to use it most effectively. For an excellent video demonstra-
tion on using this debugger with Ajax, see “Introduction to Debugging AJAX Applica-
tion with Firebug” on YouTube at
http://www.youtube.com/watch?v=W4jXAaEMp2M
(see
Figure 18.28).
Figure 18.27
Setting breakpoints with Firebug. Putting the cursor on a variable shows its value.