HTML and CSS Reference
In-Depth Information
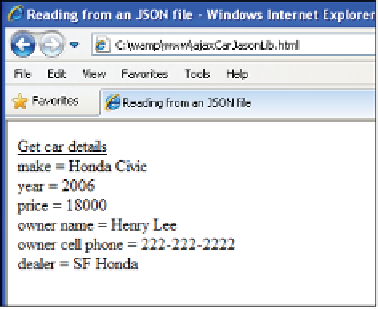
Figure 18.25
After parsing the JSON string.
Firebug (see Figure 18.26) is a Firefox extension that lets you debug and profile your
Ajax, HTML, CSS, JavaScript, and DOM applications by using tabbed browsing and a
console for errors and log messages. Firebug appears either as a separate window or as
a small panel at the bottom of your browser. The FireBug console can log all Ajax
requests live, and allows you to inspect the responses that are normally invisible. You
can see the value of the
XMLHttpRequest
object, the server's status, the
readyState
, and
so on. and with the Script debugger step through the your program line by line or stop
at specified breakpoints watching the changes in real time. Firebug's inspectors allow
you to see the CSS rules and watch DOM nodes as they are being created, modified, and
removed by JavaScript in real time. Firebug's Script tab contains a powerful debugger
that lets you pause JavaScript execution on any line. You can then step forward line-by-
line to analyze how the state of the program changes in real time. Firebug also lets you
specify the circumstances under which a breakpoint is triggered and lets you browse
code as well as edit it.