HTML and CSS Reference
In-Depth Information
You can also use a version of Firebug in Internet Explorer, Opera, and Safari called
Firebug Lite. See
http://getfirebug.com/lite.html.
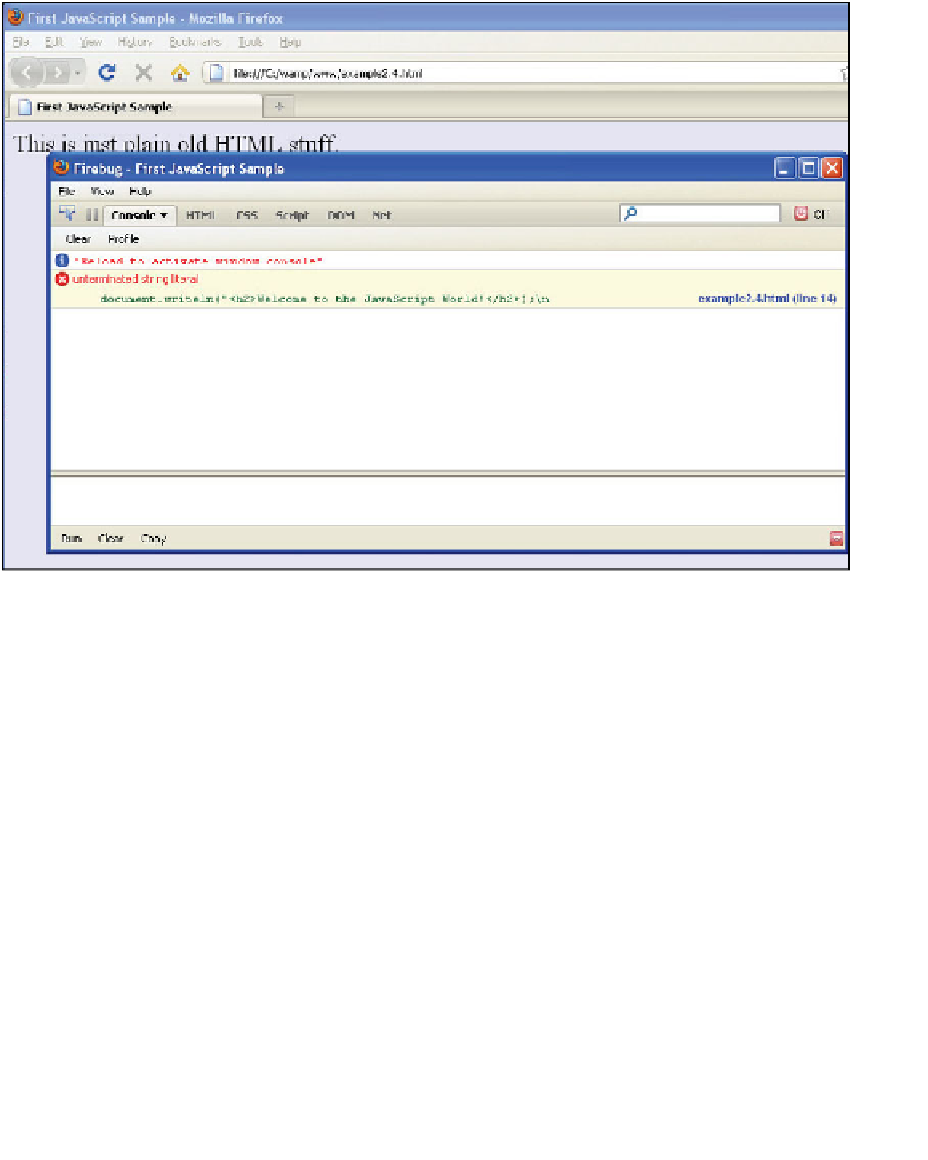
Figure 2.6
The Firebug Debugging window.
When an error occurs in your JavaScript program, a little yellow triangle appears in the bot-
tom left corner of the browser window. If you double-click the triangle, a debugging window
opens explaining the error and the line number where it occurred (see Figure 2.7).
Internet Explorer Developer Tools.
Every installation of Internet Explorer 8 comes
with the Developer Tools for debugging JavaScript (Microsoft JScript), HTML, and CSS on
the fly. It comes with a plethora of features including the ability to control script execution,
set break points, inspect variables, profile performance, edit and prototype new designs, and
To start debugging your JavaScript programs, open the Developer Tools and switch to
the Script tab, then click Start Debugging. When starting the debugging process, the
Developer Tools will refresh the page and you will have all the functionality you expect
from a debugger (see Figure 2.8). Once you are done, click Stop Debugging. Go to Inter-
net Explorer Tools/Developer Tools and the debugger window will appear. Click Script,
and then restart your program in the browser.