Environmental Engineering Reference
In-Depth Information
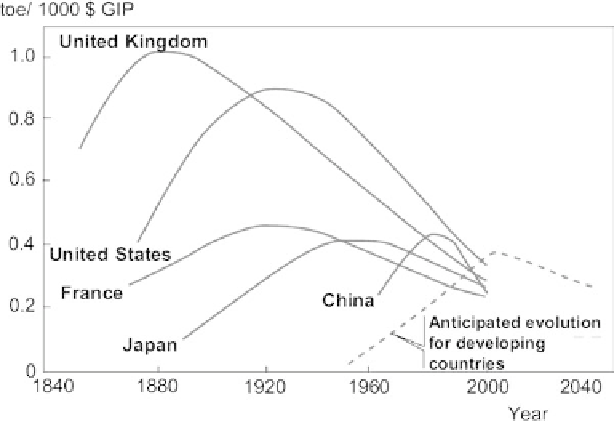
Figure 5.1 Evolution of the energy intensity (toe/1000 US $) (
Source
: Le Monde
Diplomatique)
US $ GIP in 2004). However, it can be observed that during recent years
this decrease has stopped [38].
Ultimately, the energy intensity of all countries tends towards a value
close to 0.2 toe/1000 US $ GIP. Nevertheless, although the energy effi-
ciency tends to decrease, the consumption of energy rises, as a result of the
combined effect of demography and improving standard of life.
As an indicator, the energy intensity has to be used with care. Indeed, a
reduction of the energy intensity can be presented as a success, but may be
not sufficient, if it is more than compensated by the growth of the GIP. It is
necessary to reach a reduction of the energy consumption in absolute
terms and only as related to a permanently increasing GIP.
The value of the GIP as a development indicator is also more and more
frequently challenged. It does not take into account the depletion of
natural resources or environmental damage. Other indicators have been
proposed. The Genuine Progress Indicator (GPI) takes into account
positive and negative effects upon the environment and the society in
order to correct the indications of the GIP. In the USA, while the GIP per
inhabitant has roughly tripled within the last fifty years, the GPI has
remained almost constant. Different trials have been made for taking into
account the quality of life, by introducing indicators which take into
account an index reflecting the feeling of well-being and satisfaction of the
people. The Happy Planet Index is obtained by considering the product of
Search WWH ::

Custom Search