Environmental Engineering Reference
In-Depth Information
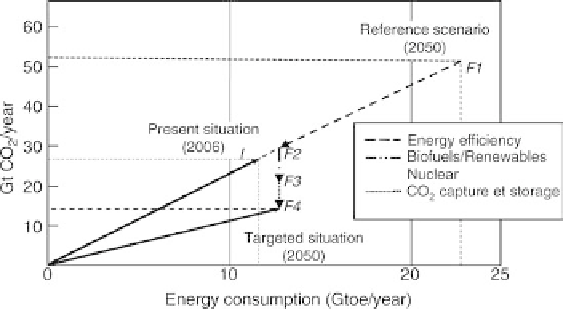
Figure 9.2 Evolution scenario of the world energy demand and of CO
2
emissions
between now and 2050. Reproduced with permission fromEnergie&Climat: Reussir
la transition energetique by Alexandre Rojey,
´
ditions Technip, Paris, 2008
tons per year are plotted versus the energy consumption expressed in
billions of tons of oil equivalent per year.
The reduction of CO
2
emissions is achieved by using three of the four
action points already mentioned:
- Improving energy efficiency leads by 2050 to a reduction of around
23Gt/year of CO
2
emissions (moving from point F1 to point F2).
- Increasing the share of low carbon energy in the energy mix makes
a reduction of CO
2
emissions of around 7.5Gt/year possible (moving
from point F2 to point F3).
- CCS and carbon sinks lead to a further reduction of CO
2
emissions of
around 7Gt/year (moving from point F3 to point F4). Carbon sinks
(voluntary reforestation operations or biomass production for the
purpose of removing carbon from the atmosphere) represent only a
limited share of this total amount, not exceeding around 1Gt/year.
The deployment of CCS will require a huge effort. Indeed, in the case
of an operation like the one at Sleipner, the flow rate of CO
2
injected
underground is 1Mt/year and on a worldwide scale the equivalent
of 6000 to 7000 operations of that type are needed by 2050 to reach
the required reduction in level of CO
2
emissions.
Figure 9.3 presents the evolution with time of worldwide CO
2
emissions
in the reference (BAU) scenario and in the Alt scenario. It shows the
relative impact of the different factors involved.
Search WWH ::

Custom Search