Geography Reference
In-Depth Information
5. The role of spinof s in the early growth phase
We have collected detailed information on every i rm active in the cluster since the 1960s.
They have been divided into dif erent groups based on their prior experience: diversi-
fying entrants (i rms entering new or established markets unknown to them), parent
spinof s (new entities founded by established companies), joint ventures, entrepreneurial
spinof s (i rms founded by experienced persons with previous employment in incumbent
i rms in the industry) and inexperienced entrants (founded by persons with no previous
employment in the industry). The evolution of the population of i rms, based on types of
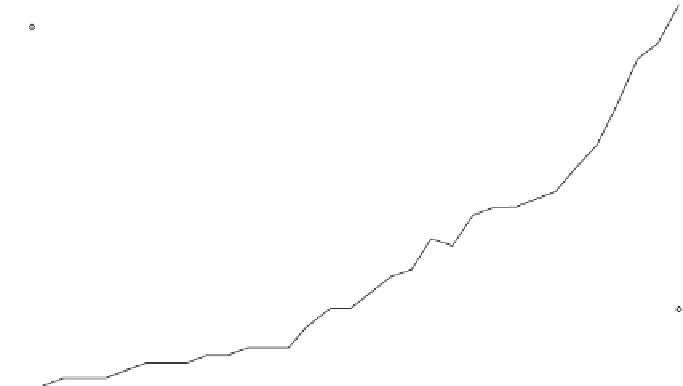
entry is shown in Figure 9.1. We have intentionally left out the two joint venture i rms to
keep the graph visible.
Figure 9.1 shows that the entrepreneurial spinof i rms represented a large share of the
increase in the population. They were a driver of cluster growth during the entire period.
They represent the largest group of i rms. The total population has grown to more than 50
i rms and the number of exits is low. Several i rms have, however, been rescued from exit
on the verge of bankruptcy after being taken over, typically by multinational companies.
Figure 9.1 shows that the second i rm entered in 1973 as a spinof from S.P. Radio. A
decade later the number of i rms had increased to six of which three were spinof s, two
were diversii ers (including S.P Radio) and a single inexperienced entrant. The introduc-
tion of mobile communications in Denmark in 1981 and the subsequent market growth
inl uenced the emergence of the cluster. The success of Dancall and Cetelco and their
growth in employment resulted in several spinof s. From 1984 to 1990 the population of
i rms increased from 6 to 16. Spinof s accounted for half of these. From 1990 to 2003, the
population increased from 16 to 51. In the early 1990s, several inexperienced start-ups
entered the cluster and parent spinof s entered in the late 1990s. However, the entrepre-
neurial spinof s hold the largest share of the population of i rms.
50
INEXPERIENCED ENTRANTS
DIVERSIFYERS
ENTREPRENEURIAL SPINOFFS
PARENTS SPINOFFS
45
40
35
TOTAL POPULATION
30
25
20
15
10
5
0
1970
1975
1980
1985
1990
1995
2000
Figure 9
.
1
Evolution in the population of i rms in NorCOM by main category (1970-
2003)


