Agriculture Reference
In-Depth Information
to choose from. For example, there are many
functional forms that can be used to model
the S-shaped curve generally associated with
the growth of animals. The logistic, Gompertz,
Richards and Normal cumulative distribution
functions have all been used to model ani-
mal growth, and in many instances equally
well. These functions, however, have very
different properties (first derivative, point of
inflection, etc.). Thus, the choice of a particu-
lar function, which frequently is arbitrary,
results in vastly different inferred properties
and implications even in instances where al-
ternate models fit data equally well (St-Pierre
et al
., 1987).
although it is truly an approximation to a
partial derivative (i.e. δ
Y
/δ
X
i
). This proced-
ure was used by St-Pierre and Cobanov (2007)
for the analysis of a complex stochastic model
of quality costs in forage storage and feeding
to dairy cattle. The model consists of
13
input
variables and
3
design variables that charac-
terize the optimum sampling design for
forage in dairy production. The sampling
design identifies the optimal sampling inter-
val (
h
), number of samples to be taken (
n
) and
level of change in nutrient analysis (expressed
in standard deviations) before the process is
considered out of control (
L
).
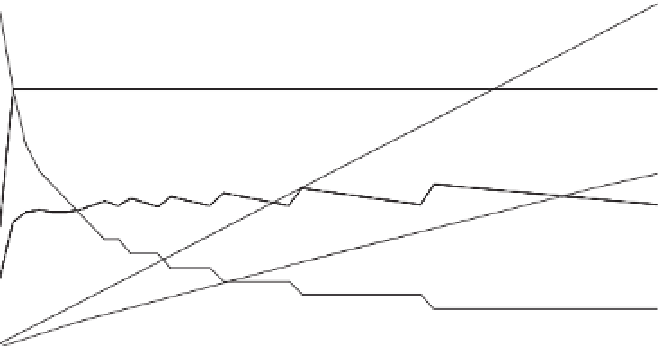
Figure 5.4
shows the outcome of a UnS analysis for herd
size, expressed as number of cows (
N
c
). Of
the three design variables, only h appears to
be sensitive to
N
c
. However, one must be very
careful in the interpretation of these results
because all variables are maintained con-
stant, while
N
c
is varied. In the real system,
it is very likely that input variables are cor-
related. In addition, parameter estimates to
the model are generally highly correlated.
The conventional UnS analysis ignores this
important aspect of stochastic models and
can lead to erroneous conclusions.
Global linear sensitivity analysis (Saltelli
et al
., 2004) and non-linear sensitivity
Sensitivity Analysis of Stochastic
Models
Sensitivity analysis is used for the identifi-
cation of important model elements. Histor-
ically, univariate sensitivity (UnS) analysis
has been the dominant method used. In a UnS
approach, all variables are set at a given
(control) value except one that is iteratively
varied from its minimum to its maximum.
Sensitivity is generally expressed as
dY/dX
i
,
30
3
600
550
25
.5
500
450
20
2
400
350
15
.5
300
250
10
1
200
150
5
.5
100
50
0
0
1,00
0
200
400
Number of cows in the herd (
N
c
)
600
800
Fig. 5.4.
Effect of number of cows in the herd (
N
c
) on optimal sampling design and total quality cost per day.
− = the sampling frequency (
h
) in days;
▲
= number of standard deviations used as control limits of the
X
-bar
chart (
L
);
à
= number of samples taken (
n
); ■ = the total daily quality cost (
C
); and o = the total daily quality
cost from current sampling design in the dairy industry (
h
= 30 days,
n
=
1,
L
=
2
sd
).