Agriculture Reference
In-Depth Information
Models used to estimate amino acid
requirements
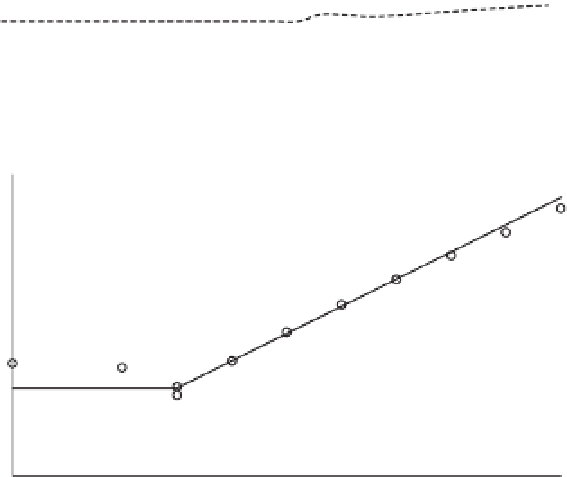
The increase in the proportion of liver
protein (
pPLiv
) during the growth peak in
the sexual maturity phase is less representa-
tive when the factors are analysed together,
but an analysis of the isolated organ is
shown in
Fig. 16.2
. A separate approach re-
veals that after the maximum growth rate of
the ovary and oviduct, there was an increase
in
pPLiv
from the 18th week, according to
the broken line equation:
pPLiv%
=1.46 -
0.45 × (
18
-
Age
(
weeks
)
) for
Age
>18th week,
when
Age
≥15th and ≤18th,
pPLiv
= 1.46.
Considering the growth parameters and coef-
ficients obtained, the models for Lys, Met+Cys
and Thr are presented below:
For Lys:
AAI
= [(
173
×
BPm
0.73
×
u
)
+ (0.04 ×
FP
× 18.7)]
+ [(67.8 ×
PD
c
)/
0.8
+ (18.7 ×
PD
f
)/
0.8
+ 67.8
× (
PD
Ova
+
PD
Ovi
+
PD
Liv
)/
0.8
] (16.6)
Age (weeks)
1.0
1
4
7
10
13
16
19
22
25
0.8
0.6
0.4
0.2
0.0
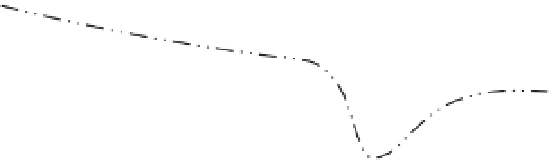
Fig. 16.1.
Rate of protein deposition in each of the protein components of the body over time relative to the
total amount deposited. Feather-free body
.
.
.
; feathers
.
.
; ovary ; oviduct
..............
; and
liver .
0.050
0.045
0.040
0.035
0.030
0.025
0.020
0.015
0.010
0.005
0.000
15
17
19
21
23
25
Age (weeks)
Fig. 16.2.
Protein deposition in the liver as a proportion (g/kg) of the total amount deposited in the body
(feather-free body + feathers + ovary + oviduct + liver). Observed values ; predicted values
.