Agriculture Reference
In-Depth Information
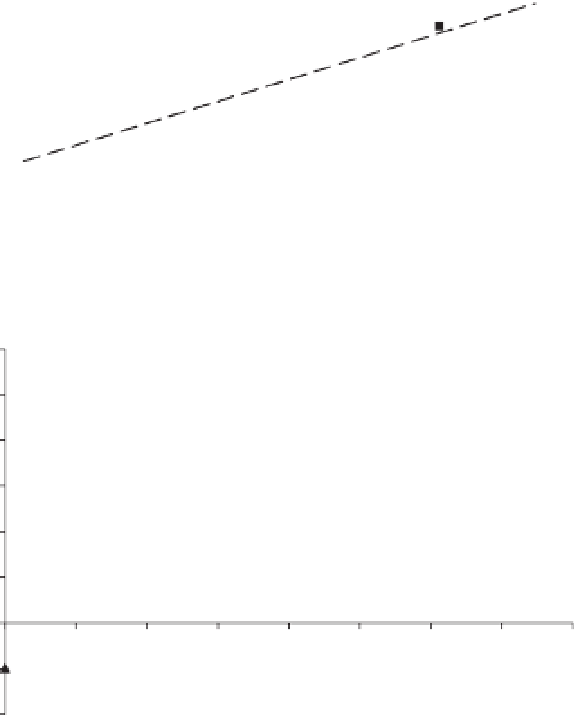
2200
NB
= -
191
(±59.7) + 2.53 (±0.2) Thr
(
r
2
= 0.60)
1800
1400
1000
600
200
−
200
0
0
100 150 200 250 300
350 400 450 500 550 600 650
−
600
0.73
−
1000
Threonine intake (mg/BP
m
day)
Fig. 15.2.
Graphic representation of threonine intake (mg/
BP
0.73
day) as a function of nitrogen balance in
two chicken genotypes (Bovans White
▲
and Cobb
■
).
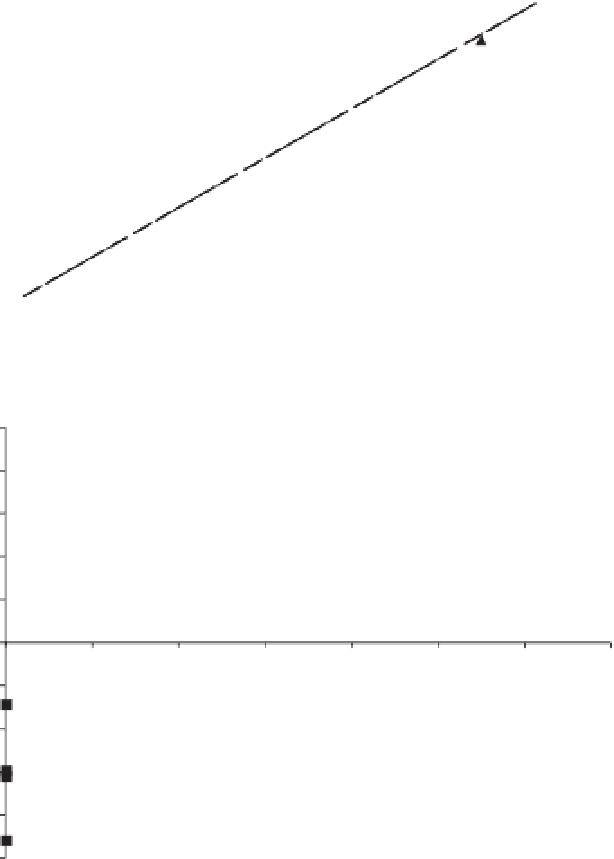
1200
NB
=
−
304
(±38.5) + 3.56 (±0.2) Lys
r
2
= 0.94
1000
800
600
400
200
0
0
50
100
150
200
250
300
350
400
−
200
0.73
Lysine intake (mg/BP
m
day)
−
400
Fig. 15.3.
Graphic representation of lysine intake (mg/
BP
0.73
day) as a function of nitrogen balance (Bovans
White genotype).
NB
=
−
501.5 (53.4) + 2.29 (±0.20) Lys
r
2
= 0.89
1000
800
600
400
200
0
0
100
200
300
400
500
600
700
−
200
−
400
−
600
−
800
0.73
−
1000
Valine intake (mg/BP
m
day)