Agriculture Reference
In-Depth Information
(a)
3.5
3.0
2.5
2.0
1.5
3.037
2.954
2.860
2.838
1.0
0.5
0.0
(b)
68.0
66.0
64.0
62.0
60.0
65
64
58.0
61
61
56.0
54.0
(c)
118.0
116.0
114.0
112.0
110.0
116
108.0
112
112
106.0
109
104.0
102.0
Low health
High health
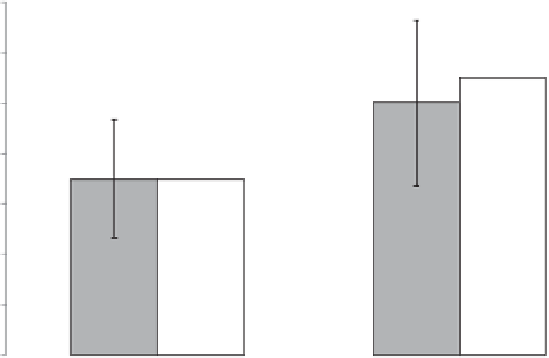
Fig. 14.11.
Comparison of Actual (
) and Predicted (
£
) body weight (a), growth rate (b) and feed intake (c) of
1-
to
46-
day-old broilers reared in High or Low Health status farms. Bars represent one standard deviation.
Unlike some available broiler models
with similar purposes, Avinesp also allows
the estimation of growth and the nutri-
pullets. Estimates obtained with Avinesp
for growth and responses to nutrient intake,
health challenge and environmental tem-