Agriculture Reference
In-Depth Information
reduction, which may be interpreted as an
indication of maintenance. The slope (
b
)
represents the extent of the change in
ADG
associated with the reduction in
ADFI
be-
tween challenged and control broilers, and
is an indication of feed efficiency. The preci-
sion of the regression equations of ∆
ADG
as
a function of ∆
ADFI
was acceptable (
R
2
>
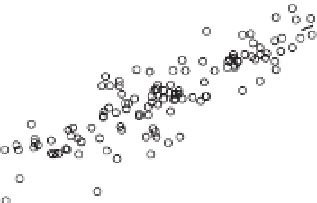
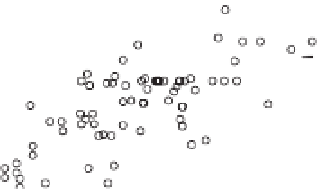
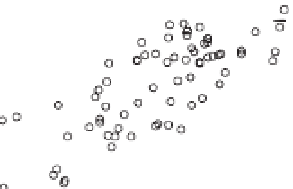
0.60) for all challenges, although a signifi-
cant part of the variation remained unex-
plained (
Fig. 14.4)
. The intercepts of all
challenges (
Salmonella
spp.,
Clostridium
spp. and
E. coli
) differed from zero and were
negative (-2.2, -0.70 and -1.76, respect-
ively) indicating that all challenges in-
creased maintenance requirements. More-
over, the curvilinear response showed that
the higher the reduction in ∆
ADFI
, the worse
the feed efficiency for all health challenges.
The detailed results of this meta-analysis
was published (Remus
et al
., 2014) else-
where. Therefore, we may conclude that the
evaluated health challenges had an import-
ant effect on maintenance requirements.
Growth rate reduction
The model uses a health profile that can be
modified, depending on the health status of
the bird, by adjusting growth rate (
B
). Based
on the meta-analysis an average value (20%)
was adopted, representing maximal growth
rate reduction (
B
) in the presence of health
challenge. The health coefficient of the pro-
file is used to reduce
B
and, therefore,
PD
,
LD
and feed intake, accordingly. The sever-
ity of the reductions in
PD
,
LD
, live weight
and feed intake depends on the health sta-
tus of the bird.
Increase in maintenance requirements
There is no consistent information on
the maintenance requirements of poultry
reared in poor health conditions. Our meta-
analysis showed a weak effect of disease on
maintenance, and therefore, we decided to
(a)
(b)
20
10
0
0
−
25
−
10
−
20
−
50
−
30
−
20
−
10
0
10
0
10
(c)
(a) Birds challenged with
Salmonella
spp.
0
Y
=
−
2.229 + 1.138
×
X
−
0.004383
×
X
2
R
2
= 75.6%
−
5
(b) Birds challenged with
Clostridium
spp.
Y
=
−
0.7014 + 0.7850
×
X
−
0.0284
×
X
2
−
10
R
2
= 50.3%
(c) Birds challenged with
Escherichia Coli
−
15
Y
=
−
1.760 + 0.5643
×
X
−
0.02510
×
X
2
R
2
= 58.1%
−
20
−
20
−
10
0
1
0
Fig. 14.4.
Relationship between growth (∆
ADG
) and feed intake (∆
ADFI
) changes in birds challenged with
Salmonella
spp.,
Clostridium
spp. or
Escherichia coli
. Responses are expressed as results of the challenged
birds relative to the control group. Lines represent quadratic model adjustments. Estimated parameters
differed from zero (
P
>0.05).


