Information Technology Reference
In-Depth Information
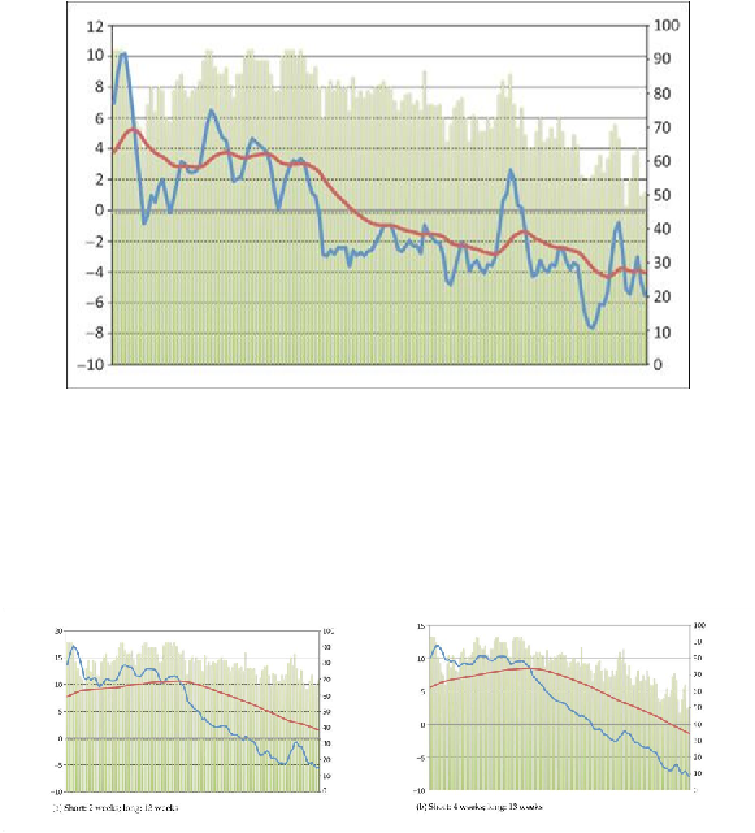
Figure 18.5: Noisy data from a 1-week short period and a 4-week long period
However,increasingtheshortperiod,inparticular,willtendtodelaytriggeringachange
intrendevent.In
Figure18.6
,
thedownwardtrendistriggered2daysearlierwitha2-week
short period (
Figure 18.6a
) than with the 4-week short period (
Figure 18.6b
)
, keeping the
long period constant at 3 months. However, the 2-week short period also has a little ex-
tra noise, with a downward trigger followed 2 days later by an upward trigger, followed a
week later by the final downward trigger.
Figure 18.6: Effect of changing only the short period
When choosing your long and short periods, you can validate the model by seeing if
older data predicts more recent data. If it does, it is reasonable to conclude that the model
will be a good predictor in the near-term future. Start with existing data, as far back as you

Search WWH ::

Custom Search