Information Technology Reference
In-Depth Information
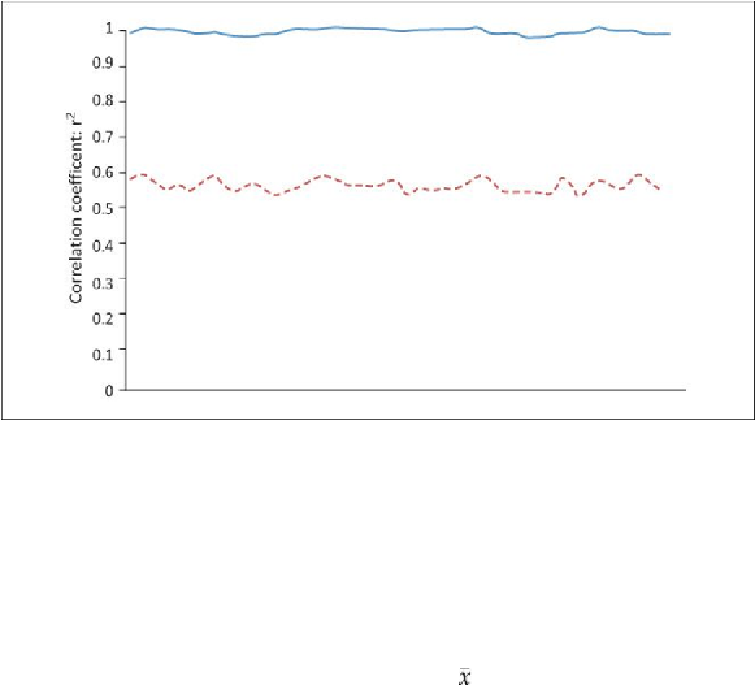
Figure 18.3: The upper line shows a high correlation of over 96% between two data
sources. The lower line shows low correlation—less than 60%.
When changes in a core driver correlate well with changes in usage of a primary re-
source, you can derive an equation of the form
y
=
a
+
bx
, which describes the relationship
betweenthetwo,knownasthe
regression line
.Thisequationenablesyoutocalculateyour
primary resource requirements based oncore driver measurements. Inother words,given a
value for your core driver
x
, you can calculate how much of your primary resource
y
you
think you will need, with a confidence of
R
2
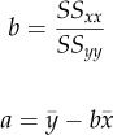
. To calculate
a
and
b
, first calculate the
mov-
ing
average of the last
n
data points for
x
and
y
, giving and . Then:
Correlation between metrics changes over time, and should therefore be graphed and
tracked with a rolling correlation analysis, rather than assessed once and assumed to be
constant. Changes in the service can have a significant impact on correlation. Changes in
the end-user demographic are usually slower, but can also affect correlation by changing
how the average customer uses the service.

Search WWH ::

Custom Search