Information Technology Reference
In-Depth Information
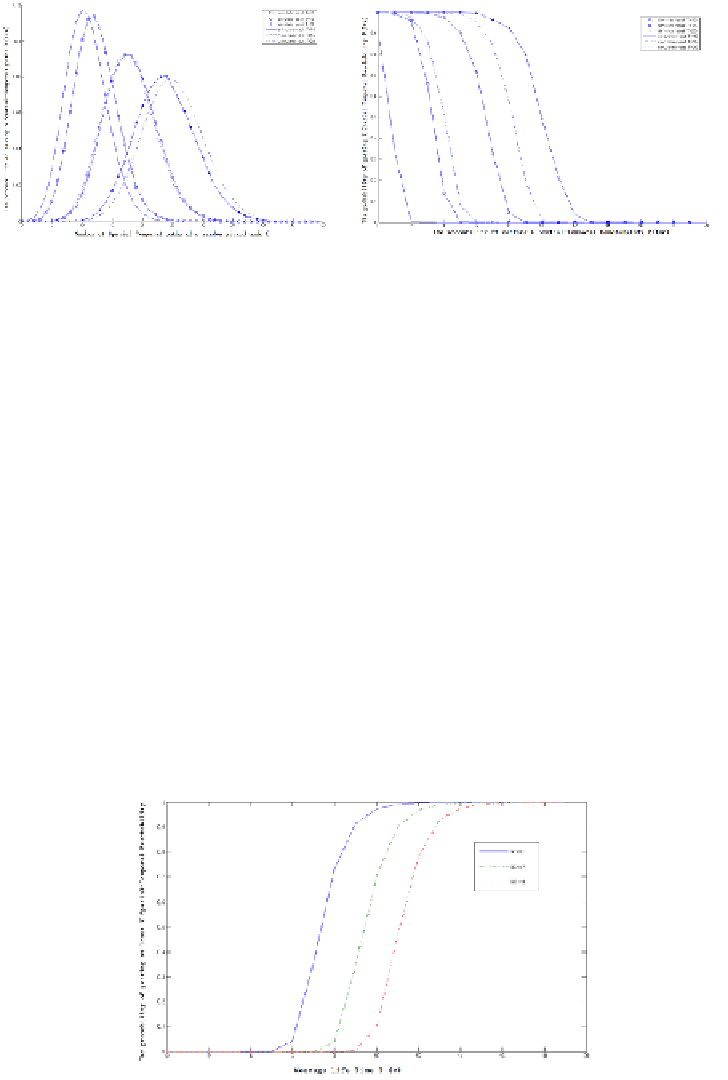
Fig. 5.
Comparison for simulation results and analytical results
Fig. 5 shows that simulation results fit well with the analytical results. Probability
for all the nodes having 18 Spatial-Temporal links with a certain node S is 9% in both
analytical and simulation results; when T=20s, analytical results show that the proba-
bility for all the nodes having 26 Spatial-Temporal links with a certain node S is 8%,
while simulation indicates 7%.
Fig. 5 also shows the probability for all the nodes having at least n Spatial-Temporal
links (K-Reachability) in the two-dimensional Random Direction Model. We see that
there are some differences between the analytical results and the simulation, the reason
is that in our analysis process, we ignored the border effect, which can increase Spa-
tial-Temporal Reachability when nodes bounce back to regain Spatial-Temporal links
with other nodes. With Message Life Time T=15s, the analytical results show that the
probability for all the nodes having at least 3 Spatial-Temporal links is 87%, while the
simulation shows 100%; when T=20s, analytical results show that the probability for
all the nodes having at least 6 Spatial-Temporal links is 95%, while the simulation
shows 100%.
With the analysis above, we can get the probability of a network being at least
K-Reachable for each Message Life Time.
Fig. 6.
Probability of a network being K-Reachability for each Message Life Time