Information Technology Reference
In-Depth Information
Tabl e 1.
Number of rerouting messages received by the 95th percentile core ASes
in CDF
Initial failure
Cascading failures
α
=0.1
α
=0.5
α
=0.9
0
.
25
×
10
3
3
.
47
×
10
5
6
.
01
×
10
3
2
.
36
×
10
3
Intentional attack
1
.
21
×
10
5
3
.
36
×
10
3
1
.
14
×
10
3
Random breakdown
0
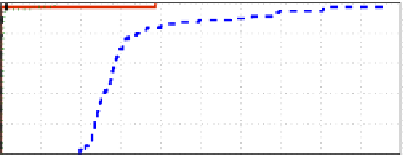
percentile core ASes receive in CDF. The amount of routing messages generated
by consequent cascading failures increases by a factor of at least 10 than that
only generated by the initial link failure. These additional overloads bring a great
deal of added burden to almost all the core ASes, crippling their routers' ability
to make routing decisions.
1
0.8
0.6
Initial failure
α
0.4
= 0.1
α
= 0.5
α
= 0.9
0.2
0
0
0.5
1
1.5
2
2.5
3
3.5
4
4.5
5
x 10
5
RM
v
Fig. 9.
Distribution of rerouting messages under intentional attack
1
0.8
0.6
Initial failure
α
0.4
= 0.1
α
= 0.5
α
= 0.9
0.2
0
0
0.5
1
1.5
2
2.5
3
3.5
4
4.5
5
x 10
5
RM
v
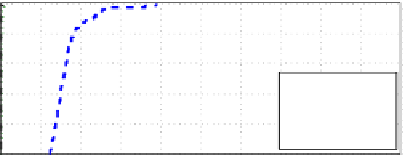
Fig. 10.
Distribution of rerouting messages under random breakdown
Moreover, if we further classify the core ASes into three ranks according to
the load they transmit for others, we find that the heaviest laden ASes are
sorted into median or low ranks. It's rational to infer that the ranked ASes
have matching capability to process routing messages. So the large amount of
additional overloads on median- and low-rank ASes will have worse effect than
that on high-rank ASes.