Biomedical Engineering Reference
In-Depth Information
(1a)
(1b)
(1c)
(1d)
(2a)
(2b)
(2c)
(2d)
(3a)
(3b)
(3c)
(3d)
(4a)
(4b)
(4c)
(4d)
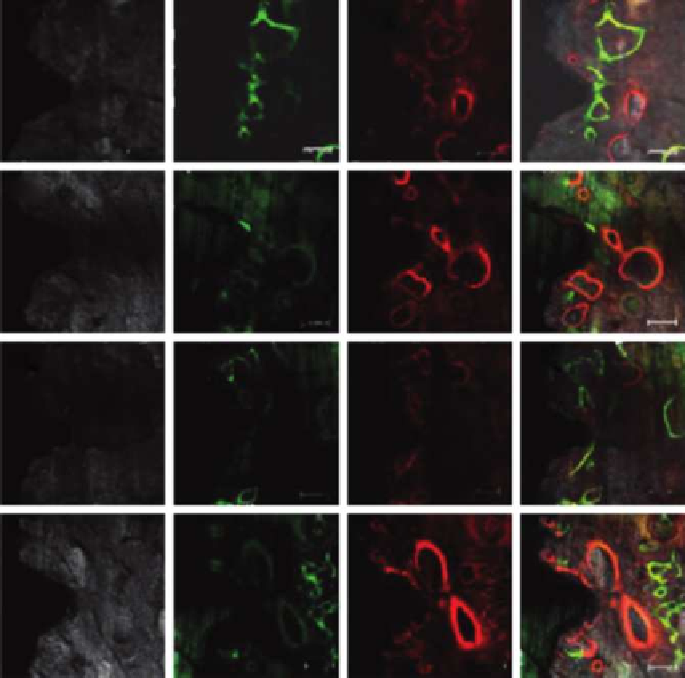
FIGURE 7.2
New bone formation was determined histomorphometrically by bone marker quantification,
representing the different healing periods in the four groups, which are enumerated as respec-
tive rows in the following matrix of images. Column (a) shows the basic confocal LASER micro-
scope image of samples. Column (b) shows fluorescence of calcein introduced 4 weeks after
implantation. Column (c) shows fluorescence of alizarin introduced 8 weeks after implanta-
tion. Column (d) shows folded images of the two fluorochromes with the basic confocal image.

Search WWH ::

Custom Search