Biomedical Engineering Reference
In-Depth Information
(a)
(b)
0.0 m
MFe mM
0.032
0.016
0.008
0.004
0.002
0.001
Tumor
50 nm
Pre-injection
0.5 h
(c)
100
(d)
pH 5.5 PBS
pH 7.4 PBS
80
60.0*
60
H*
55
40
50
20
PBS
45
0
0
5
10
15
20
40
Time(h)
100
35
(e)
80
30
P<0.05
60
25
40
20.0
20
0
39°C
42°C
Te mperature
45°C
Au NRs-MMSNEs-NIR
Au NRs-MMSNEs-DOX
Au NRs-MMSNEs-DOX-NIR
Additive therapeutic ecacy
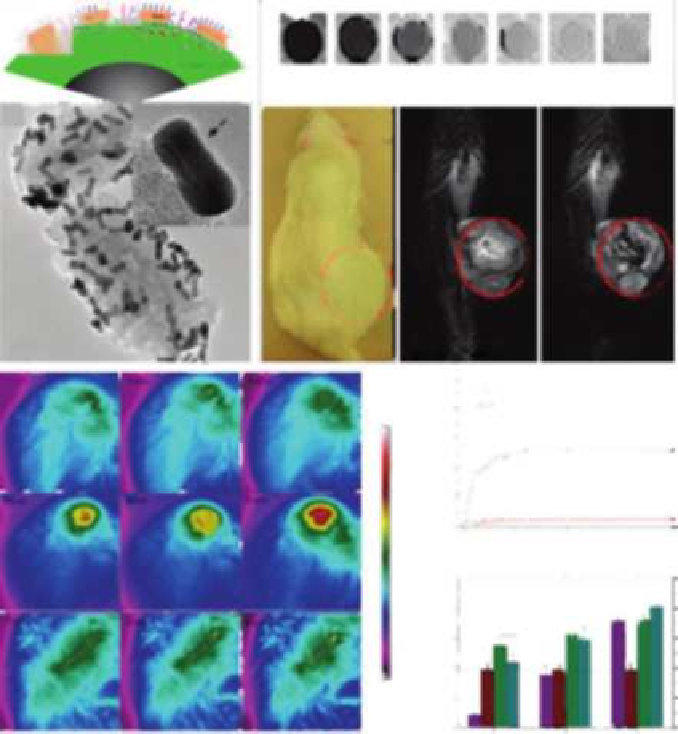
FIGURE 3.12
(a) Schematic microscopic structure and TEM image of Au NRs-MMSNEs. (b) T
2
phantom
images of Au NRs-MMSNEs at different Fe concentrations and
in vivo
MRI of a mouse before
and after intratumor injection of Au NRs-MMSNEs. (c) Infrared thermal imaging under
the photothermal heating by 808-nm laser irradiation for different time periods in Au NRs-
MMSNEs-injected tumor under (up) 1 Wcm
-2
and (middle) 2 Wcm
-2
irradiations, and (down)
PBS solution-injected tumor under 2 Wcm
-2
irradiation. (d)
In vitro
release profiles of Au
NRs-MMSNEs-DOX using dialysis membrane against PBS solution at pH 7.4 and 5.5. (e) A
comparison of inhibition rates for MCF-7 cells treated by Au NRs-MMSNEs-NIR (purple), Au
NRs-MMSNEs-DOX (red), and Au NRs-MMSNEs-DOX-NIR (green). For photothermal treat-
ment, the media were under 808-nm laser irradiation for 5 min at different power intensities,
corresponding to the maximum temperature increases to 39, 42, and 45°C. (Reprinted from Ma
M., Chen H., Chen Y., et al.,
Biomaterials
33: 989-998, 2012, with permission from Elsevier Ltd.)


Search WWH ::

Custom Search